







Every trader learns support and resistance early. The reason is simple. These levels show up on every chart, in every market, and on every timeframe. A forex pair, a stock, a gold chart, and a bitcoin chart all bounce and stall around the same kind of price areas.
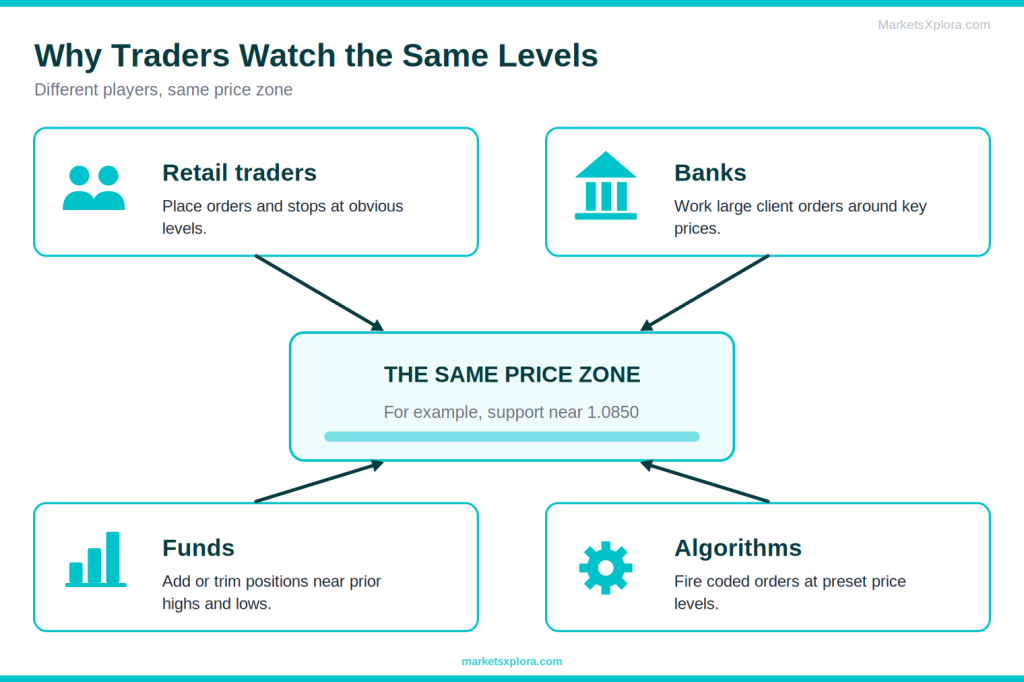
Why do the levels matter? Because many people watch them at once. Retail traders, banks, funds, and automated systems do not think alike. Still, they often look at the same prior highs, lows, and round numbers. When many orders sit at one price area, price often reacts there.
In this guide, you will learn:
- What support and resistance are
- Why these levels form and why they work
- How to draw them correctly, as zones
- How to use them with candlestick patterns
- The most common mistakes to avoid
- Real-world chart examples across markets
What Is Support?
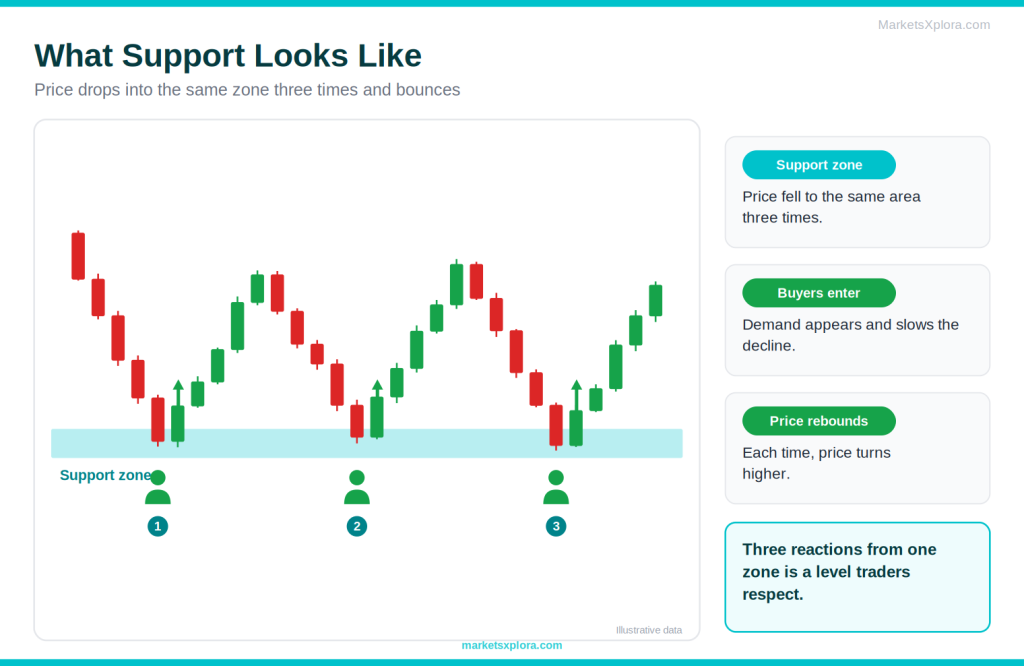
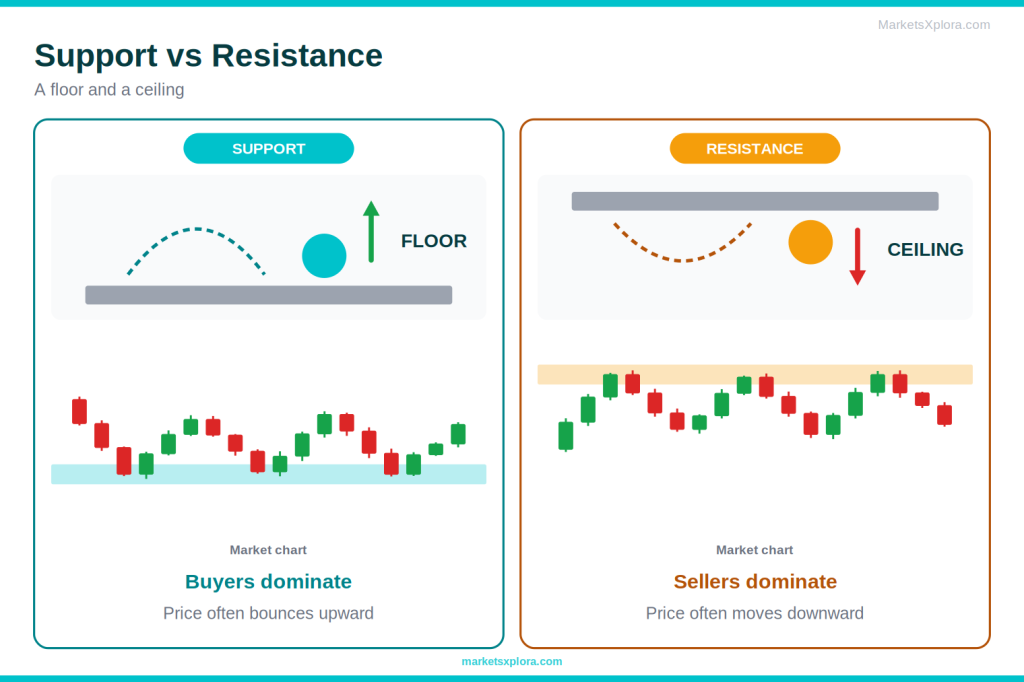
Support is a price area where buyers have become active enough to slow or stop a decline. Think of it as a floor. Price falls toward it, then bounces.
Here is a simple example. EUR/USD drops to the 1.0850 area. Buyers step in, and price rises. A few days later, EUR/USD falls to 1.0850 again and bounces again. After the third bounce, most traders will mark 1.0850 as support.
Demand zones
A support area is often called a demand zone. Demand means buyers. At that price area, enough traders see value that buy orders pile up.
Buying pressure
When price reaches support, new buyers enter. Traders who sold earlier also buy back to close their positions. Together, these orders add buying pressure and can push price higher.
Market memory
Markets seem to remember. Traders recall where price turned before. So they place orders near the same area again. That memory is why old levels keep mattering.
What Is Resistance?
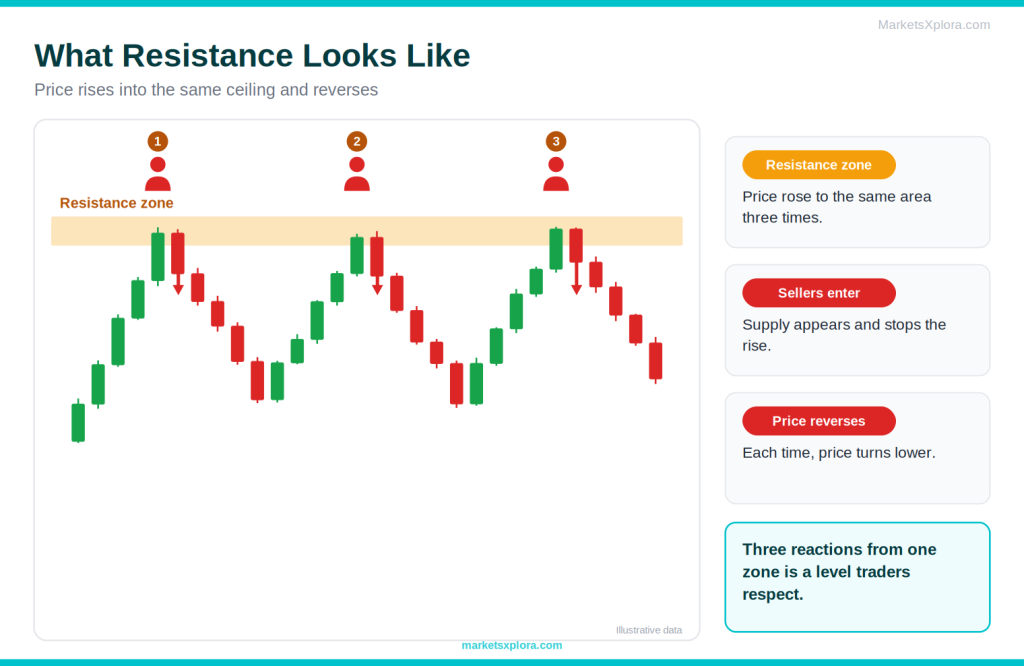
Resistance is a price area where selling pressure repeatedly stops price from rising. Think of it as a ceiling. Price rises toward it, then turns down.
For example, price climbs to 1.0950 on EUR/USD, stalls, and falls. It tries again and fails again. Once price has failed there a few times, traders mark 1.0950 as resistance.
Supply zones
A resistance area is often called a supply zone. Supply means sellers. At that price area, sell orders pile up.
Profit-taking
Traders who bought lower often sell near a prior high to lock in gains. Many sell at the same area. That selling can stop a rally.
Seller activity
Some buyers also bought near the old high and got stuck in a loss. When price returns to their entry, many sell to break even. That adds even more supply at the level.
Why Support and Resistance Work
Market psychology
Markets move because people trade, and people repeat behavior. Fear and greed drive many decisions. A trader who missed a rally says, “I will buy if it drops back there.” A trader who sold too early says, “I will not miss it next time.” These thoughts cluster at the same prices, so reactions repeat.
Institutional activity
Large traders cannot fill huge orders at one price. They split them up and often work them around obvious areas. Stop-loss orders also cluster just beyond prior highs and lows. Traders call these clusters liquidity pools. When price reaches them, volume often rises, and price can react sharply.
Research supports the idea in at least one market. A study by New York Fed economist Carol Osler found that published support and resistance levels in forex predicted pauses in intraday trends better than chance. Treat that as a hint, not a promise that every level works.
The self-fulfilling prophecy
Levels also work partly because traders expect them to work. If thousands of traders watch the same level, and they place orders there, the level reacts. The belief helps create the result. That is also why obvious levels matter more than hidden ones.
Support vs Resistance
Support |
Resistance |
|
|---|---|---|
Analogy |
Acts as a floor |
Acts as a ceiling |
Who dominates |
Buyers |
Sellers |
Typical reaction |
Price often bounces upward |
Price often moves downward |
Sits relative to price |
Below current price |
Above current price |
If it breaks |
Price may fall further (breakdown) |
Price may rise further (breakout) |
After a break |
Often becomes resistance |
Often becomes support |
How to Draw Support and Resistance Correctly
Drawing levels is a skill. Most beginners draw too many lines, too close to price, and too thin. Follow these four steps instead.
Step 1: Zoom out
Beginners often start too close. On a zoomed-in chart, every small bounce looks important. Zoom out to the daily or 4-hour chart first. Levels on higher timeframes matter more, because more traders watch them.
Step 2: Identify repeated reactions
Look for places where price turned more than once. Strong reversals matter most. A level that caused a sharp, fast move away tells you that many orders sat there.
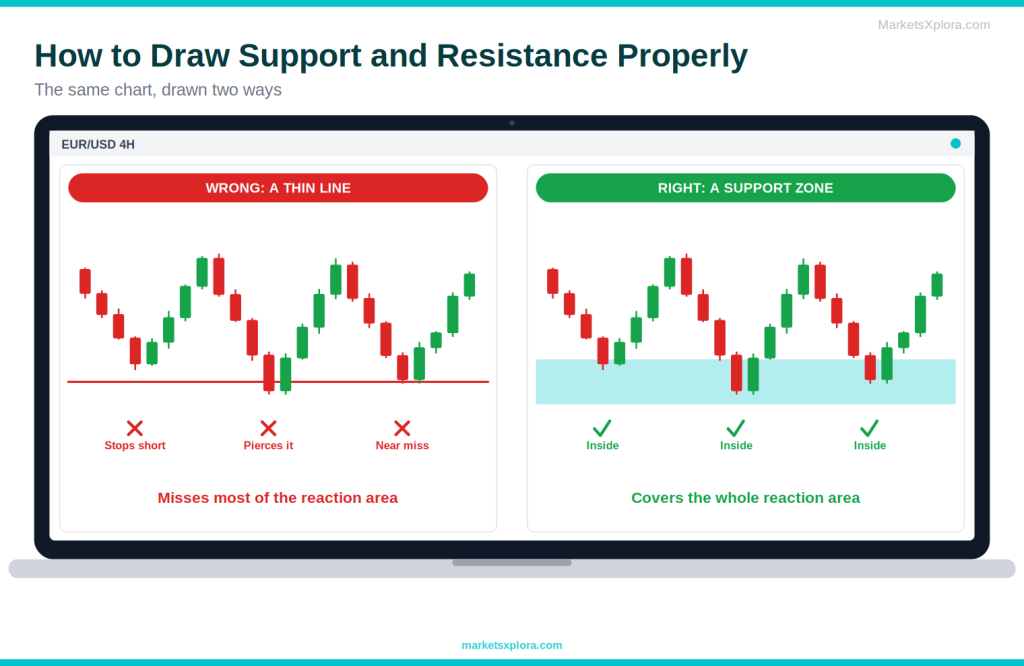
Step 3: Draw zones, not exact lines
This is the most important step. Markets rarely reverse at one exact price. One bounce may stop at 1.0848, the next at 1.0855, and a third at 1.0842. A thin line at 1.0850 would look wrong on two of the three. A zone from 1.0842 to 1.0855 captures all three.
- Draw the zone from where candle bodies cluster to where the wicks reach.
- Keep the zone as narrow as the evidence allows. Do not stretch it to cover every outlier.
- On a line chart, use closing prices to place the zone.
Step 4: Validate with more touches
Check whether the zone held in the past. Two touches show a possible level. Three or more show a level that traders respect. Still, quality beats quantity. One sharp reversal can matter more than three weak touches.
The Different Types of Support and Resistance
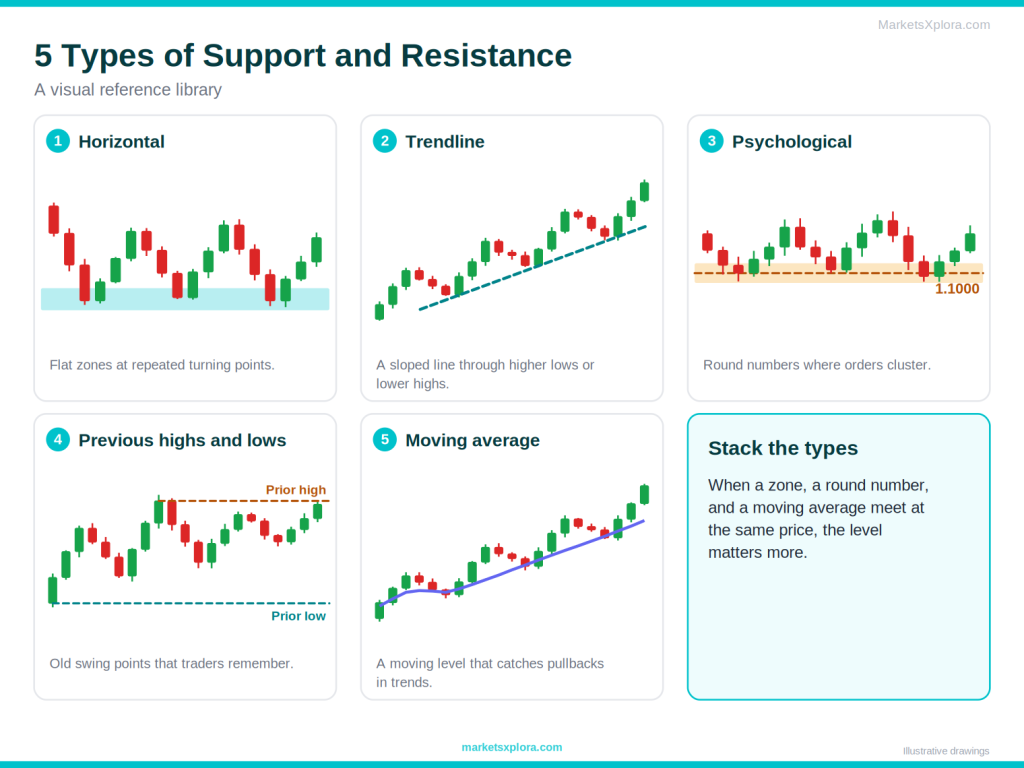
Horizontal support and resistance
These are flat levels drawn across the chart. They are the most common type. Traders mark them at repeated turning points.
Trendline support and resistance
A trendline is a sloped line. In an uptrend, you connect the higher lows to make a rising support line. In a downtrend, you connect the lower highs to make a falling resistance line. Use at least two points to draw it. A third touch confirms it.
Psychological levels
Traders love round numbers. Orders cluster at them because people think in round figures. Examples include 1.1000 on EUR/USD, $4,000 on gold, and $100,000 on bitcoin. Whether a given round number acts as a level depends on the market, but round numbers are often worth a look.
Previous highs and lows
A prior swing high or low is one of the most reliable levels. Other useful ones include the previous day’s high and low, the previous week’s high and low, and all-time highs. Traders remember them, so orders gather there.
Moving average support and resistance
A moving average is a line that shows average price over a set number of candles. In trends, price often pulls back to the 20, 50, or 200-period average and reacts. The average then acts like a moving level.
Dynamic vs Static Support and Resistance
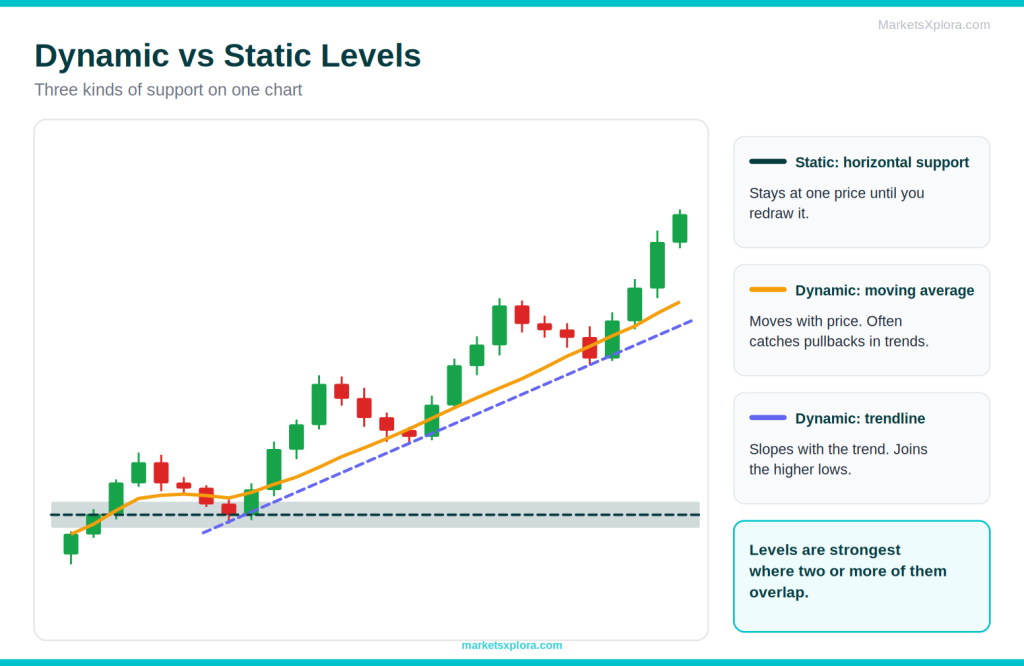
Static levels
Static levels are horizontal. They stay at the same price until traders redraw them. Prior highs, lows, and round numbers all fall in this group.
- Easy to see and widely watched
- Simple to draw
- Work well in ranges
- Can become outdated
- Need redrawing as the market changes
Dynamic levels
Dynamic levels move with price. They include moving averages, trendlines, and channels. A channel uses two parallel trendlines to frame price between a rising or falling floor and ceiling.
- Adapt to the trend
- Help you follow pullbacks in trends
- Depend on settings, such as average length
- More subjective, so two traders may draw different lines
In practice, traders combine both. A horizontal zone and a rising average that meet at the same price can create a strong area of interest.
Support Becoming Resistance
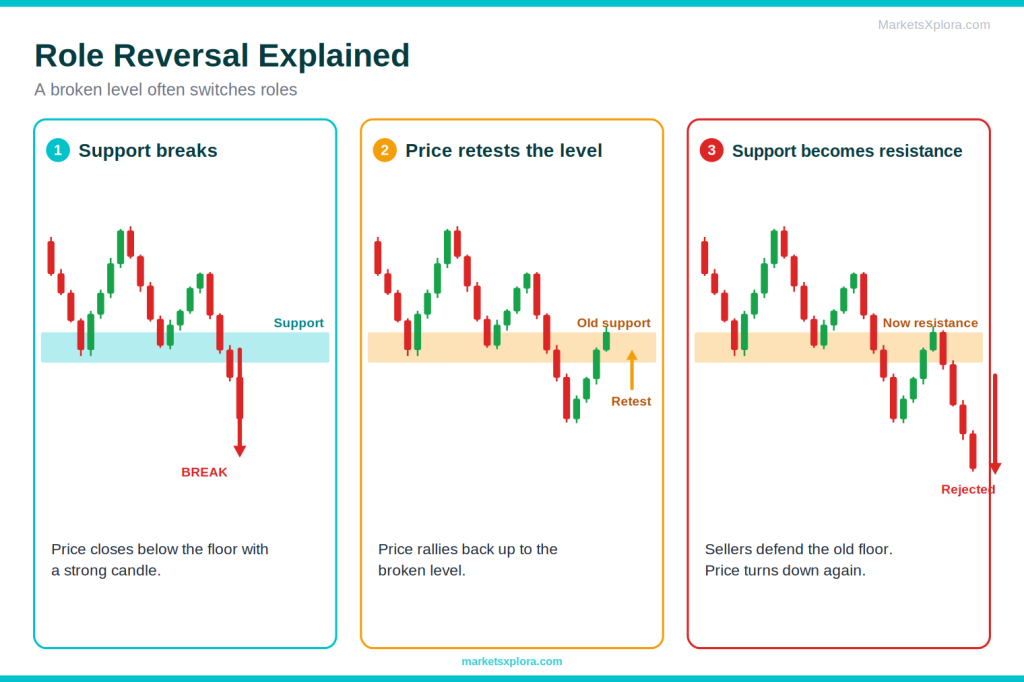
This is one of the most important ideas in technical analysis. Traders call it role reversal or polarity. A broken level often switches roles.
What happens after a breakdown?
When price breaks below support, that old floor can become a new ceiling. Why? Traders who bought at support are now losing. When price rallies back to their entry, many sell to exit near breakeven. New sellers also see the level and join in. Together, they create resistance.
What happens after a breakout?
When price breaks above resistance, the old ceiling can become a new floor. Traders who sold at resistance and got caught may buy back near their entry. Traders who missed the breakout look to buy on a pullback. Both groups add demand at the old level.
Remember that role reversal is a tendency, not a rule. Sometimes price slices straight through a retested level. That is why traders wait for confirmation.
How to Use Support and Resistance in Trading
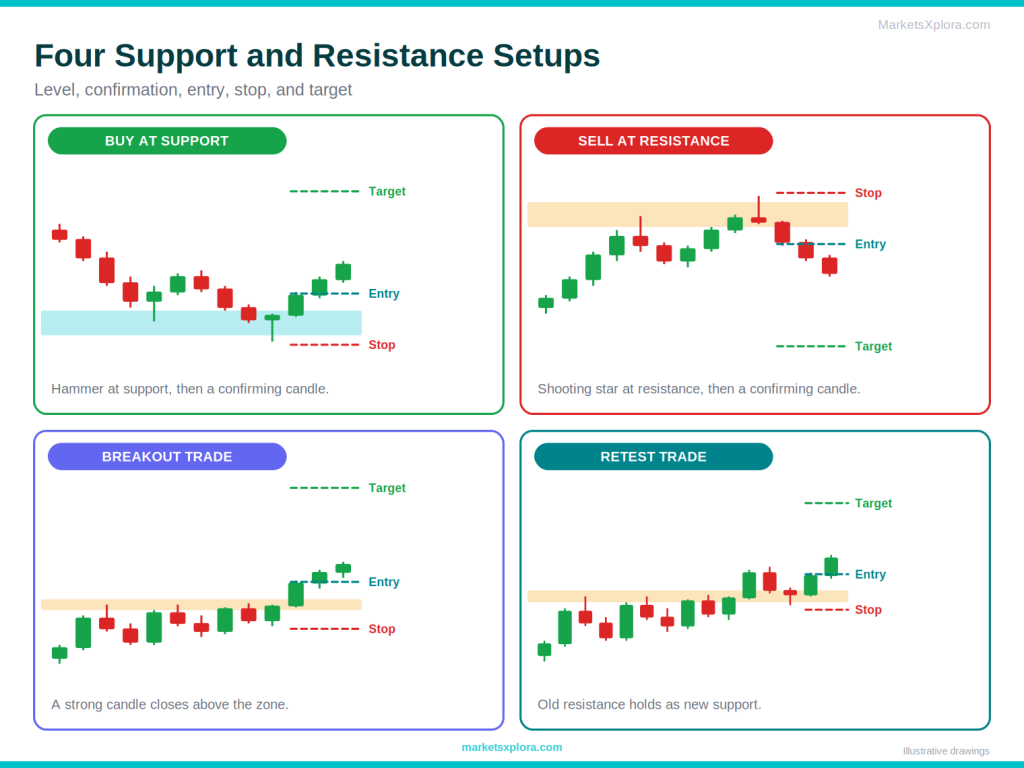
Buying near support
Traders look for buy setups when price falls to support and shows rejection, such as a long lower wick. They place the stop loss just below the zone. The target is often the next resistance.
Selling near resistance
Traders look for sell setups when price rises to resistance and shows rejection, such as a long upper wick. They place the stop above the zone. The target is often the next support.
Trading breakouts
A breakout trade enters when price closes beyond a level with a strong candle. The idea is that the move may continue. The risk is a false breakout, where price pokes through and snaps back.
Trading retests
A retest trade waits for price to break a level, return to it, and hold. For example, after price breaks resistance, a trader waits for a pullback to the old level and buys if it holds as support.
- Better entry price and tighter stop
- Fewer false signals than chasing the break
- Clear invalidation point
- Price may never retest, so you miss the move
- Retests can fail and reverse
Waiting for confirmation
Never trade a level on its own. Wait for confirmation, such as a rejection candle followed by a candle that closes in your direction. Confirmation costs you a little price. In return, it filters out many weak setups.
Also plan your risk before you enter. A common guideline is to look for a reward at least twice your risk, but no ratio guarantees profit. For more, read Risk Management for Beginners.
Combining Support and Resistance With Candlestick Patterns
Levels tell you where to look. Candlesticks tell you what price is doing there. Together, they give better information than either alone. For the candle basics, read How to Read Candlestick Charts.
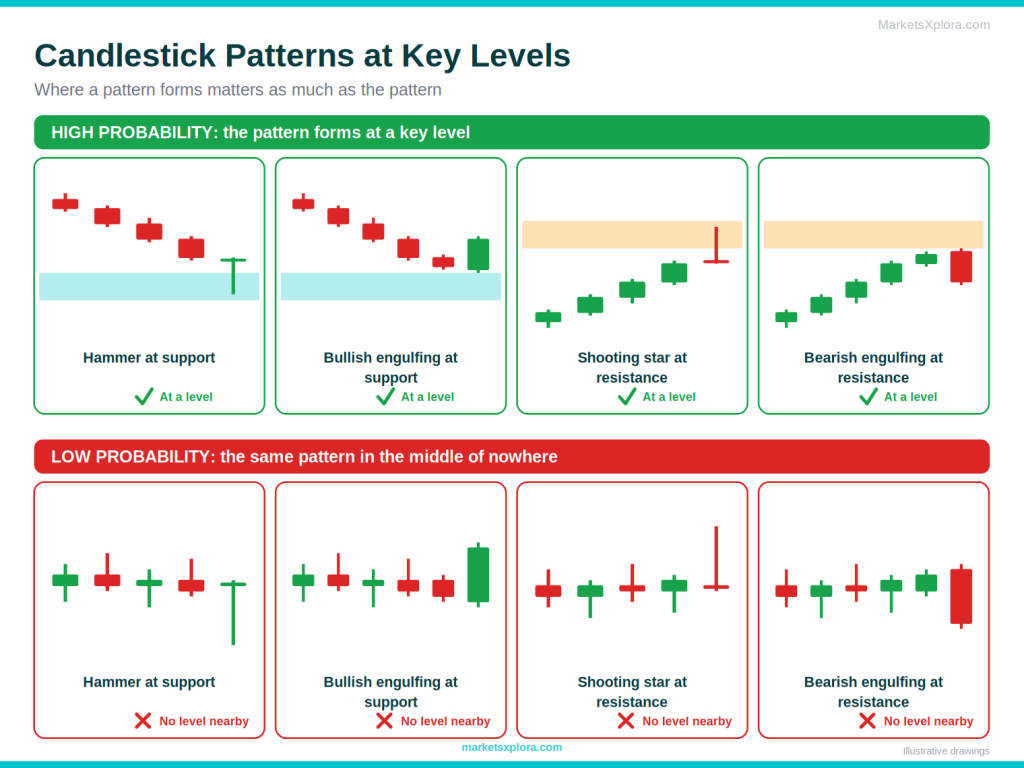
Hammer at support
A hammer has a small body and a long lower wick. At support, it shows that sellers pushed price down and buyers rejected the low. It hints at a bounce.
Bullish engulfing at support
A bullish engulfing candle is a large bullish candle that covers the body of the previous bearish candle. At support, it shows buyers taking control.
Shooting star at resistance
A shooting star has a small body and a long upper wick. At resistance, it shows that buyers pushed price up and sellers rejected the high. It hints at a pullback.
Bearish engulfing at resistance
A bearish engulfing candle is a large bearish candle that covers the previous bullish body. At resistance, it shows sellers taking control.
Why context matters
The same pattern has very different value in different places. A hammer at a clear support zone, after a decline, is a stronger signal. A hammer in the middle of nowhere means little. Always ask where the pattern formed.
Support and Resistance Across Different Markets
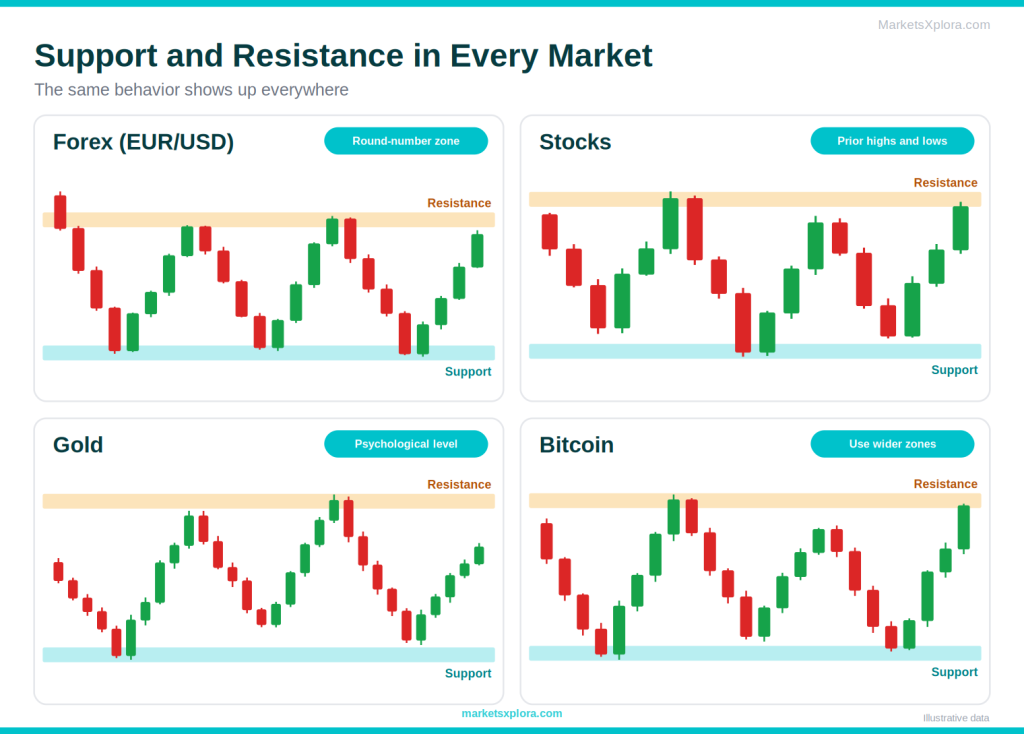
Support and resistance work on any market with a price chart. The reason is simple: people trade all of them, and people behave in similar ways. Still, each market has its own quirks.
Forex
Forex trades around the clock on weekdays. Round numbers, such as 1.1000 or 1.1050, often attract orders. Brokers’ price feeds differ slightly, so zones work better than exact numbers. Session highs and lows, such as the previous New York or London range, are also popular levels.
Stocks
Stocks have reported volume, which helps you judge how strong a reaction was. Earnings gaps and prior day highs and lows often create levels. Round prices, such as $50 or $100, can act as psychological levels.
Indices
Stock indices follow the broad market. They often react at round numbers, such as every 1,000 points on a large index, and at prior all-time highs. Index levels get a lot of attention from institutions.
Commodities
Commodities, such as gold and oil, also react at round numbers and prior highs and lows. Gold traders watch whole-dollar levels like $4,000. News can move these markets quickly, so wait for confirmation.
Cryptocurrency
Crypto trades 24 hours a day, 7 days a week, and moves fast. Round numbers, such as $100,000 on bitcoin, and prior highs often act as levels. Because crypto is volatile, use wider zones and favor higher timeframes.
Real Support and Resistance Examples
Example 1: Forex support bounce
- Chart: EUR/USD on the 1-hour timeframe.
- Level: A support zone sits at 1.0840 to 1.0855. Price has bounced from it twice.
- Candle: On the third touch, a hammer forms with a low of 1.0836. The next candle closes at 1.0868.
- Plan: Enter near 1.0870. Place a stop at 1.0828 (42 pips risk). Target 1.0954 (84 pips). The ratio is 2:1.
Example 2: Resistance rejection
- Chart: A stock on the daily timeframe.
- Level: A resistance zone sits at $148 to $150. Price has turned down from it twice.
- Candle: A shooting star forms with a high of $151.20. The next day closes at $146.80.
- Plan: A trader who sells short enters near $146.50, places a stop at $151.80 ($5.30 risk), and targets $135.90 ($10.60). The ratio is 2:1. Many beginners do not short stocks, and a long trader would simply avoid buying here.
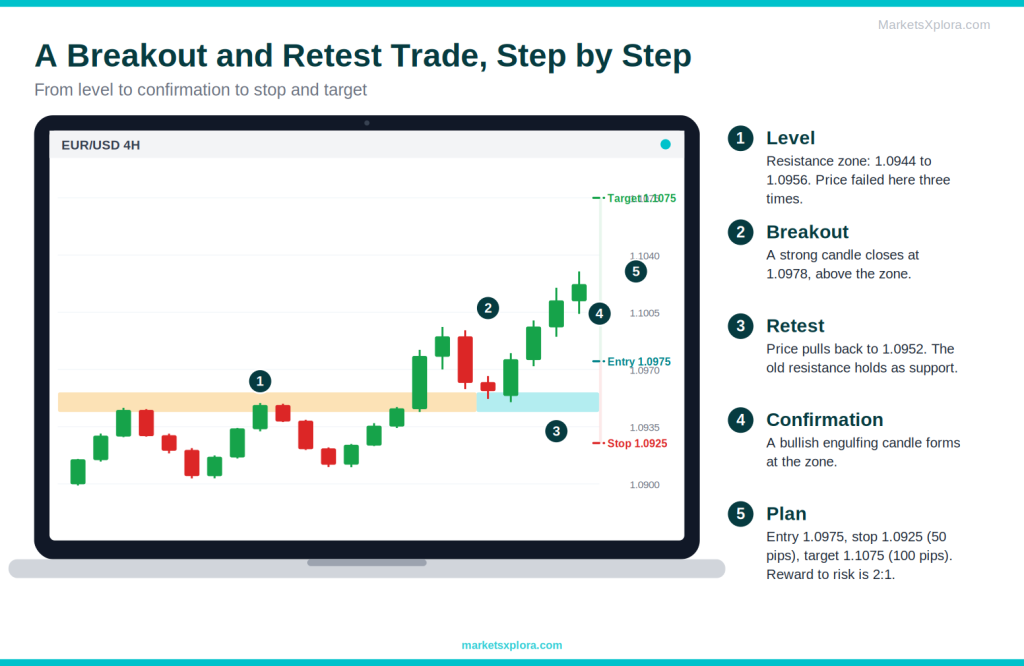
Example 3: Breakout and retest
- Chart: EUR/USD on the 4-hour timeframe.
- Level: Resistance at 1.0950 breaks when a strong candle closes at 1.0978.
- Retest: Price pulls back to 1.0952. The old resistance holds as new support, and a bullish engulfing candle forms.
- Plan: Enter near 1.0975. Place a stop at 1.0925 (50 pips risk). Target 1.1075 (100 pips). The ratio is 2:1.
Example 4: False breakout
- Chart: EUR/USD on the 1-hour timeframe.
- Level: Resistance zone at 1.0940 to 1.0950.
- Trap: Price spikes to 1.0968, then closes back at 1.0941, inside the zone. Breakout buyers are now trapped.
- Confirmation: The next candle closes at 1.0936, below the zone.
- Plan: A seller enters near 1.0934. Place a stop above the false-breakout high at 1.0975 (41 pips risk). Target the support near 1.0852 (82 pips). The ratio is 2:1.
In every example, the trader found the level first, waited for a candle to confirm, and set the stop and target before entering.
Common Support and Resistance Mistakes
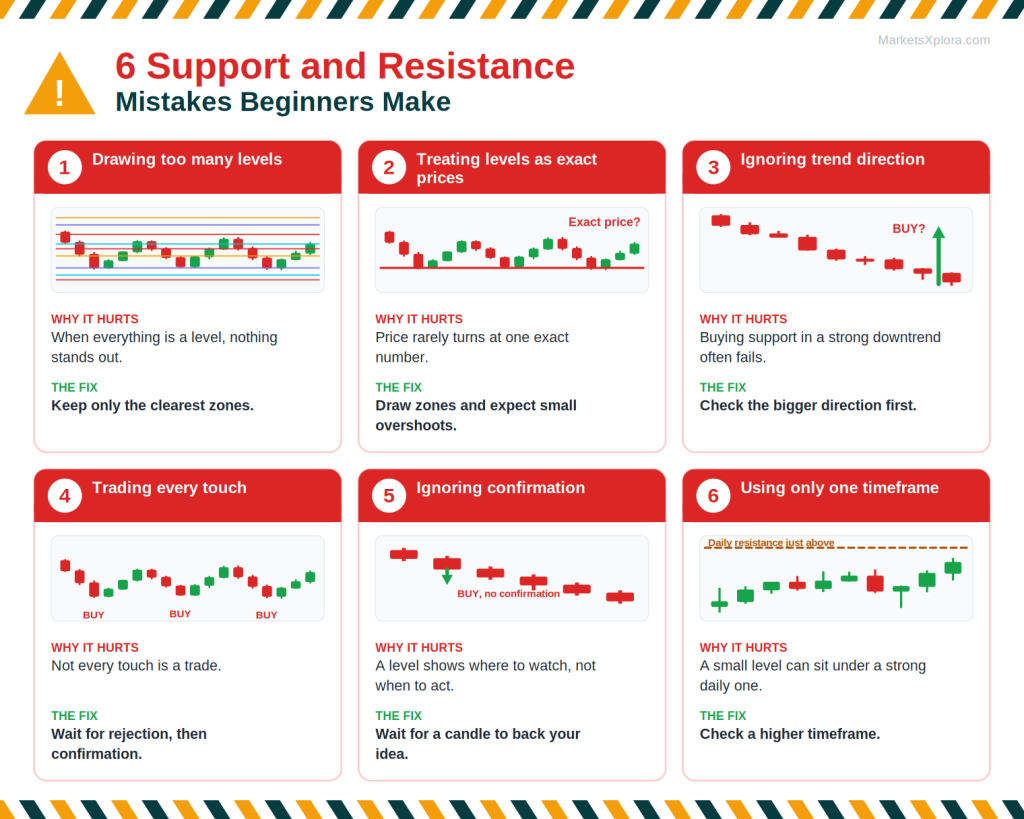
Drawing too many levels
A chart full of lines is useless. When everything is a level, nothing stands out. Keep only the clearest zones.
Treating levels as exact prices
Price does not respect a single number. Use zones, and expect small overshoots.
Ignoring trend direction
Buying at support in a strong downtrend often fails. Support tends to work better in uptrends, and resistance tends to work better in downtrends. For more on trends, read Trend Trading for Beginners.
Trading every touch
Not every touch is a trade. Wait for rejection and confirmation. Also, each test of a level can use up the orders sitting there, so a level that has been hit many times may break soon.
Ignoring confirmation
A level tells you where to watch, not when to act. Without confirmation, you are guessing.
Using only one timeframe
A level on a 5-minute chart can sit right under a strong daily resistance. Always check a higher timeframe.
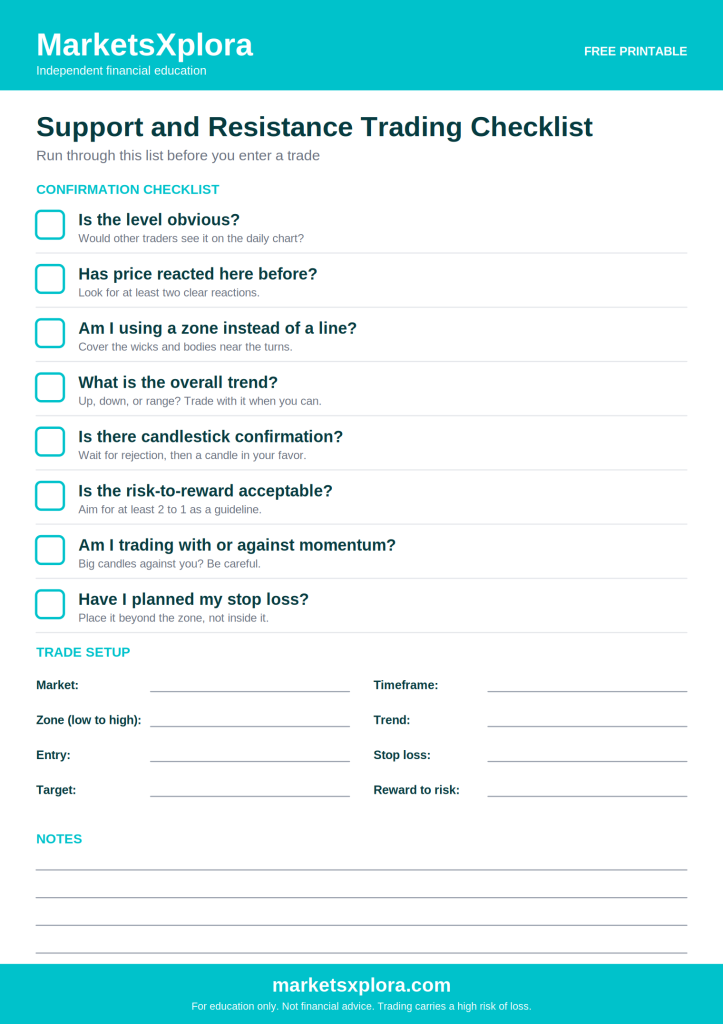
Support and Resistance Trading Checklist
Run through this list before you enter a trade.
- ☐ Is the level obvious?
- ☐ Has price reacted here before?
- ☐ Am I using a zone instead of a line?
- ☐ What is the overall trend?
- ☐ Is there candlestick confirmation?
- ☐ Is the risk-to-reward acceptable?
- ☐ Am I trading with or against momentum?
- ☐ Have I planned my stop loss?
⬇ Download the Support and Resistance Trading Checklist (PDF)
Advanced Concepts (Optional)
Support and resistance flips
This is the role reversal idea at a deeper level. Advanced traders track how price behaves at flipped levels to judge whether a breakout is genuine.
Supply and demand zones
Supply and demand zones are areas where price left quickly, which suggests strong buying or selling. They look like thick support and resistance zones, but traders define them by the start of the move instead of repeated touches.
Liquidity sweeps
A liquidity sweep happens when price moves just beyond a prior high or low to trigger clustered stop orders, then reverses. Traders watch for it as a sign that large players collected liquidity.
Stop hunts
A stop hunt describes a sharp move that runs through obvious levels to trigger stops. Traders often use the term loosely. A fast spike beyond a level does not always mean someone targeted you.
Order blocks
An order block is the last opposing candle before a strong move. Some traders treat it as a zone where large orders sit. It is a popular idea in smart money trading, but it is not a proven edge.
Fair value gaps
A fair value gap is a three-candle pattern where the first and third candles leave a gap in the middle candle’s range. Some traders expect price to return and fill it. Treat it as one more area to watch.
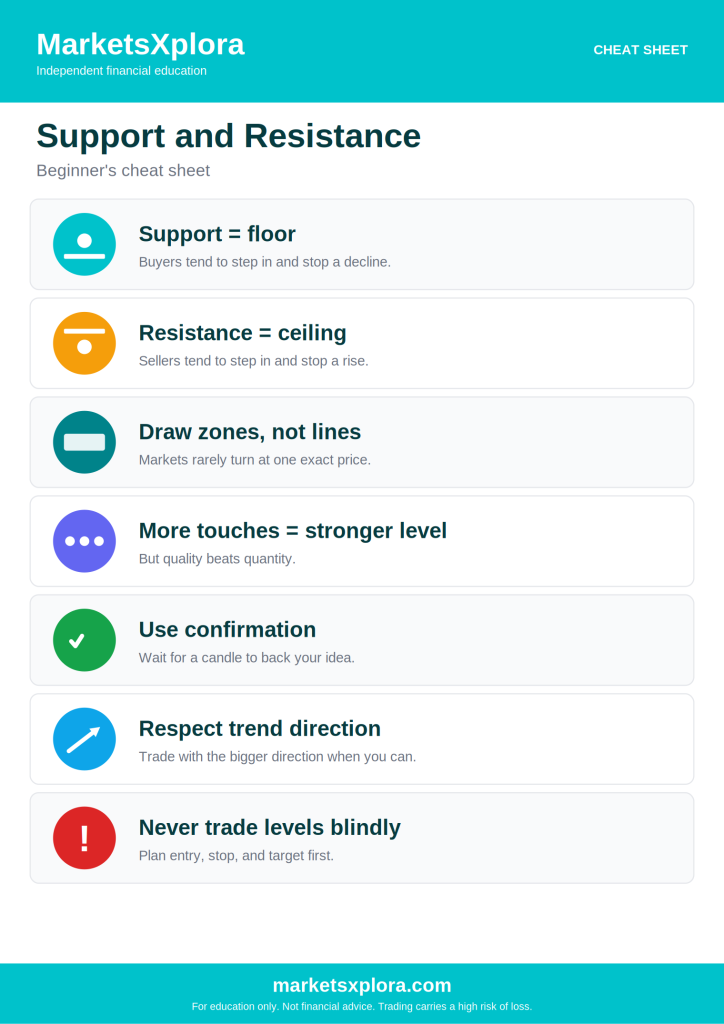
Beginner’s Support and Resistance Cheat Sheet
- Support = floor. Buyers tend to step in.
- Resistance = ceiling. Sellers tend to step in.
- Draw zones, not lines. Markets rarely turn at one exact price.
- More touches, stronger level. But quality beats quantity.
- Use confirmation. Wait for a candle to back your idea.
- Respect the trend. Trade with the bigger direction when you can.
- Never trade levels blindly. Plan entry, stop, and target first.
⬇ Download the Support and Resistance Cheat Sheet (PDF)
Frequently Asked Questions
Final Thoughts
Support and resistance are not magical lines that predict the future. They are areas where market participants have repeatedly shown interest. Learning to identify these zones correctly can help you improve entries, exits, and overall market understanding.
Start simple. Zoom out, mark a few clear zones, wait for confirmation, and plan your risk. Then practise on a demo account until the process feels natural.
Keep learning
- How to Read Candlestick Charts
- What Is Technical Analysis?
- What Is Fundamental Analysis?
- Trend Trading for Beginners
- Risk Management for Beginners
About the author
Samson Ononeme is the founder of MarketsXplora, an independent financial education and research platform covering cryptocurrency, forex, brokers, exchanges, trading platforms, and blockchain technology. He has more than 12 years of experience in financial content, with bylines at EarnForex, Kryptomoney, Cryptorunner, and AtoZ Markets. He turns complex financial products into clear, practical information that readers can use when they compare their options. Connect on LinkedIn and X.