






Every forex trade involves a currency pair, such as EUR/USD. The chart shows how the exchange rate of that pair changes from minute to minute, hour to hour, or day to day. Reading that chart well is one of the most important skills in forex trading.
At first, a forex chart looks like a wall of colored bars. The good news is that you only need a handful of ideas to make sense of it. This guide teaches those ideas in order, from currency pairs to a repeatable step-by-step process.
In this guide, you will learn:
- How forex charts work
- How to read currency pairs and prices
- How to understand price movements and pips
- How to identify trends
- How to find support and resistance
- How traders analyse forex charts in practice
What Is a Forex Chart?
A forex chart is a graph of a currency pair’s exchange rate over time. The vertical axis shows the price. The horizontal axis shows time. Each new price update adds to the picture.
Charts exist for two reasons. First, they track prices in real time, so you can see what the market is doing right now. Second, they store history, so you can study how price behaved in the past. Traders use both views together.
An EUR/USD example
Suppose EUR/USD trades at 1.0800 on Monday. By Wednesday, it climbs to 1.0900. By Friday, it falls back to 1.0850. A chart draws all of those moves in one view. At a glance, you can see that the euro first gained value against the US dollar, then gave some of it back.
 What a forex chart actually represents: the euro’s value measured in US dollars over time.
Understanding Currency Pairs
Forex always trades currencies in pairs. You buy one currency and sell the other at the same time. The pair name tells you which is which.
Base currency
The base currency is the first currency in the pair. It is the one you are buying or selling. In EUR/USD, the euro (EUR) is the base currency. The price you see always shows the cost of one unit of the base currency.
Quote currency
The quote currency is the second currency in the pair. It shows how much of that currency you need to buy one unit of the base. In EUR/USD, the US dollar (USD) is the quote currency.
What a forex price means
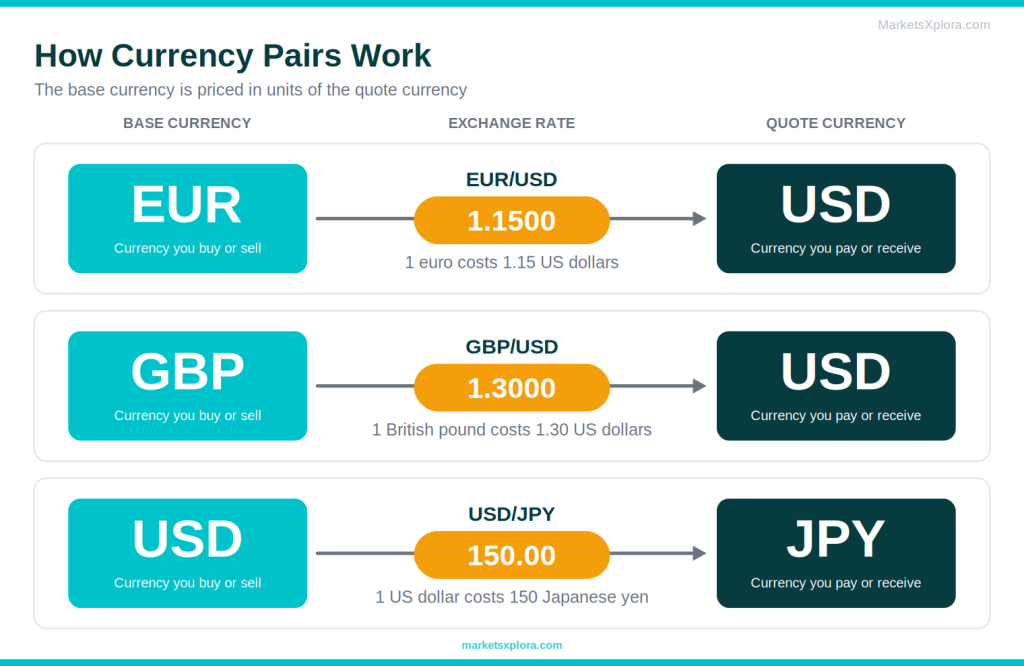
The price tells you how many units of the quote currency equal one unit of the base currency. If EUR/USD = 1.1500, then 1 euro costs 1.15 US dollars. Here are three more examples.
Pair |
Price |
What it means |
|---|---|---|
EUR/USD |
1.1500 |
1 euro = 1.15 US dollars |
GBP/USD |
1.3000 |
1 British pound = 1.30 US dollars |
USD/JPY |
150.00 |
1 US dollar = 150 Japanese yen |
When the pair’s price rises, the base currency gets stronger against the quote. When it falls, the base currency gets weaker. So a rising USD/JPY chart means the dollar is gaining on the yen.
The Different Types of Forex Charts
Most platforms offer three main chart types. They all show the same market. They just show different amounts of detail.
Line charts
- Simple and clean
- Shows the big-picture trend clearly
- Easy for a first look at a market
- Shows closing prices only
- Hides highs, lows, and intraday swings
- Gives no clue about rejection or momentum
Bar charts
- Shows open, high, low, and close
- Gives full price detail
- Many experienced traders know it well
- Small ticks are hard to scan
- Direction is less obvious at a glance
- Less beginner-friendly than candlesticks
Candlestick charts
- Shows open, high, low, and close
- Colors show direction instantly
- Patterns are easy to spot
- Default on most platforms
- Takes a little practice to read
- Can look crowded on very short timeframes
Most traders prefer candlesticks. One shape shows direction, range, and rejection together. That is why nearly every platform opens with candlesticks by default.
Which chart type should beginners use?
Use candlestick charts. They give you the most information with the least effort. You can still switch to a line chart when you want a clean view of the trend. To learn the candle shapes, read our guide on How to Read Candlestick Charts.

Understanding Forex Chart Components
Before you analyse anything, learn the parts of the screen. Every platform lays them out in a similar way.
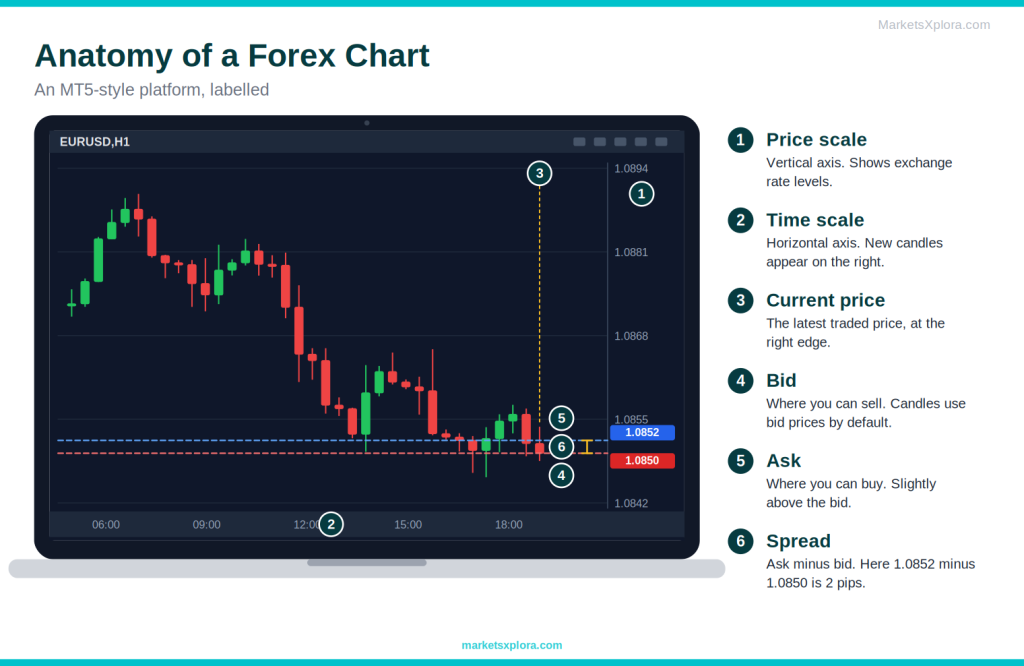
- Price axis: the vertical scale, usually on the right. It shows exchange rate levels.
- Time axis: the horizontal scale along the bottom. It shows dates and times. New candles appear on the right.
- Current price: the latest traded price. Platforms mark it with a tag or horizontal line.
- Bid price: the price at which you can sell the base currency. Most platforms, including MetaTrader, draw candles from bid prices by default.
- Ask price: the price at which you can buy the base currency. It is always slightly higher than the bid.
- Spread: the gap between the bid and the ask. It is the broker’s built-in trading cost.
How to Read Forex Prices
Understanding pips
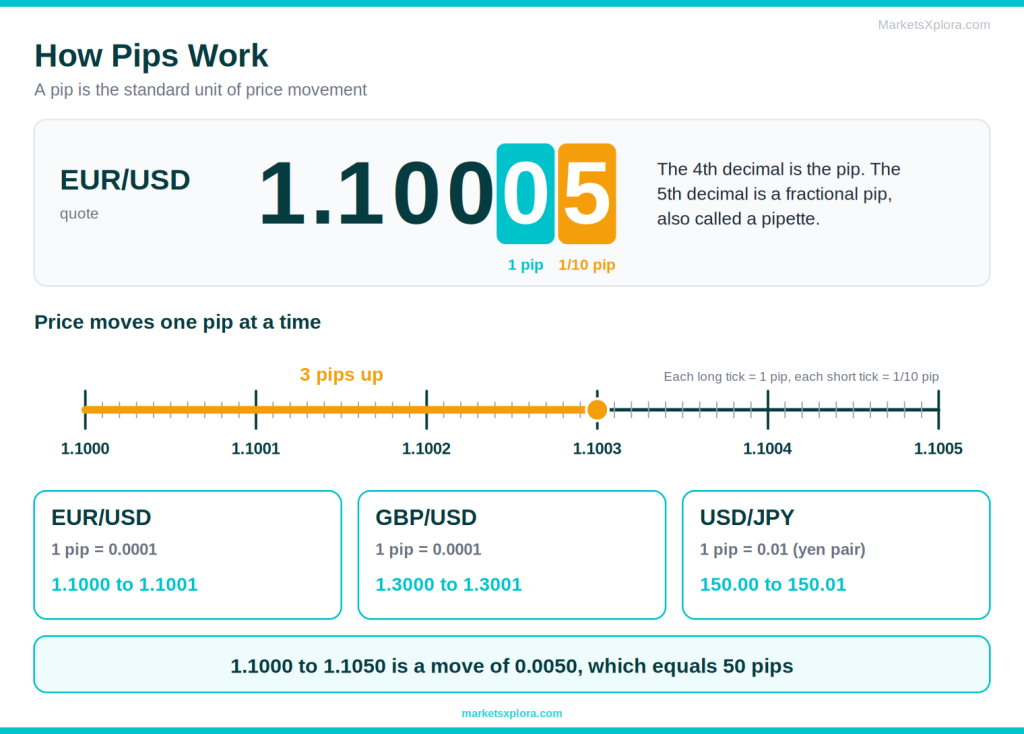
A pip is the standard unit used to measure price movement in forex. For most pairs, one pip is 0.0001. For pairs that include the Japanese yen, one pip is 0.01.
Pair |
Example price |
One pip |
A 1-pip move looks like |
|---|---|---|---|
EUR/USD |
1.1000 |
0.0001 |
1.1000 to 1.1001 |
GBP/USD |
1.3000 |
0.0001 |
1.3000 to 1.3001 |
USD/JPY |
150.00 |
0.01 |
150.00 to 150.01 |
Understanding fractional pips
Many brokers quote one extra decimal place. This extra digit is a fractional pip, often called a pipette. It equals one tenth of a pip. So EUR/USD might show 1.10005, which is half a pip above 1.1000. For USD/JPY, the extra digit is the third decimal, such as 150.005.
Calculating price movement
Subtract the old price from the new price, then convert the difference to pips.
- EUR/USD from 1.1000 to 1.1050 is a move of 0.0050, which is 50 pips.
- GBP/USD from 1.3000 to 1.3025 is 25 pips.
- USD/JPY from 150.00 to 150.40 is 40 pips.
Pips matter because they measure your stop loss, your target, and your costs. As a rough guide, one pip on a standard lot (100,000 units) of a USD-quoted pair is worth about $10. A mini lot is about $1, and a micro lot is about $0.10.
Understanding Forex Timeframes
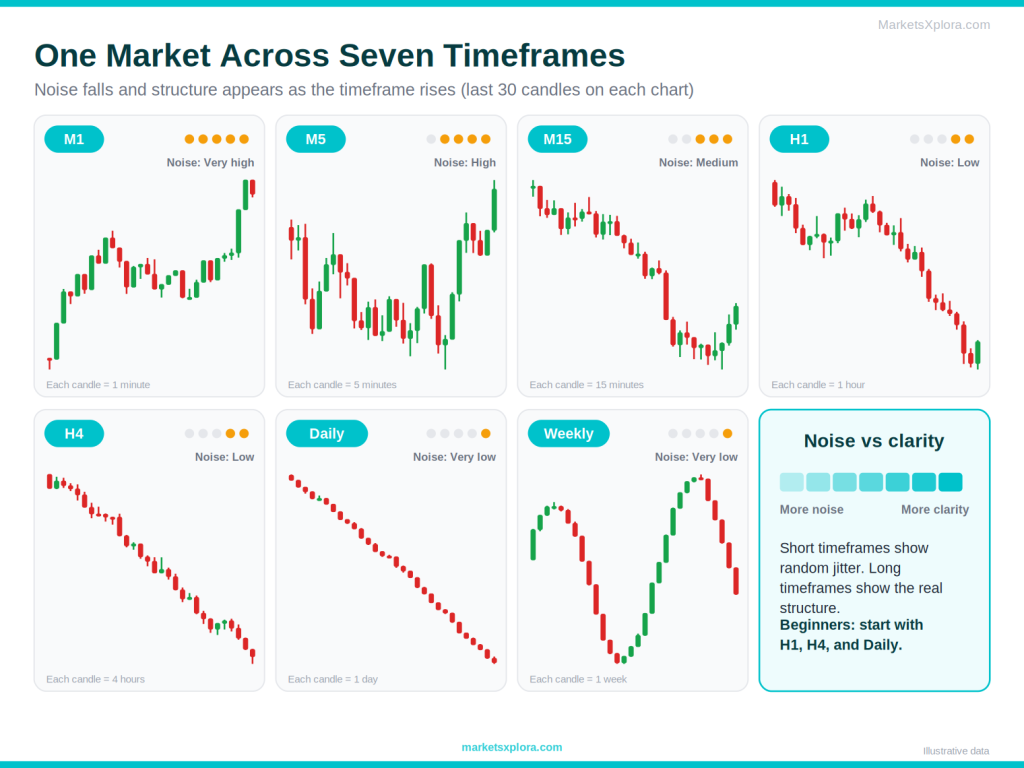
A timeframe sets how much time each candle covers. On an H1 chart, each candle shows one hour. On a daily chart, each candle shows one day. The same market can look calm on one timeframe and wild on another.
1-minute charts (M1)
Who uses it: Scalpers.
- Fast feedback
- Many setups
- Very noisy
- Spreads take a big share of small moves
- Stressful for beginners
5-minute charts (M5)
Who uses it: Scalpers and active day traders.
- Quick trades
- Cleaner than M1
- Still noisy
- Needs constant attention
15-minute charts (M15)
Who uses it: Day traders.
- Good balance of speed and clarity
- False signals still appear
- Needs hours of screen time
1-hour charts (H1)
Who uses it: Day traders and swing traders.
- Clear structure
- Manageable pace
- Slower setups
- Wider stops
4-hour charts (H4)
Who uses it: Swing traders.
- Filters out most noise
- Suits part-time traders
- Fewer setups
- Wider stops mean smaller position sizes
Daily charts (D1)
Who uses it: Swing and position traders.
- Most reliable structure
- One check per day
- Slow to develop
- Wide stops
- Weekend gaps
Weekly charts (W1)
Who uses it: Position traders and long-term analysts.
- Shows the big picture
- Marks major levels
- Very slow
- Very few signals
- Huge stops
Which timeframe is best for beginners?
Most beginners do best on the 1-hour, 4-hour, and daily charts. These timeframes have less noise, so trends and levels look cleaner. You also get more time to think before you act. Use the daily or weekly chart for the big picture. Then use the H1 or H4 chart to plan your trade.
The daily candle close also depends on your platform. Many brokers close the daily candle at 5 pm New York time, but this varies, so check yours.
How to Identify Trends on Forex Charts
A trend is the general direction of price. Spotting it is the first thing a trader does, because most trade ideas work better when they follow the trend.
What is an uptrend?
An uptrend is a series of higher highs and higher lows. Each rally goes a little further than the last. Each dip stops a little higher than the last. Buyers are in control.
What is a downtrend?
A downtrend is a series of lower highs and lower lows. Each bounce fails sooner than the last. Each drop goes a little deeper. Sellers are in control.
What is a range?
A range is a sideways market. Price moves between a high and a low without making progress. Neither buyers nor sellers are in control. Many beginners lose money here by forcing trades.

Understanding Support and Resistance
What is support?
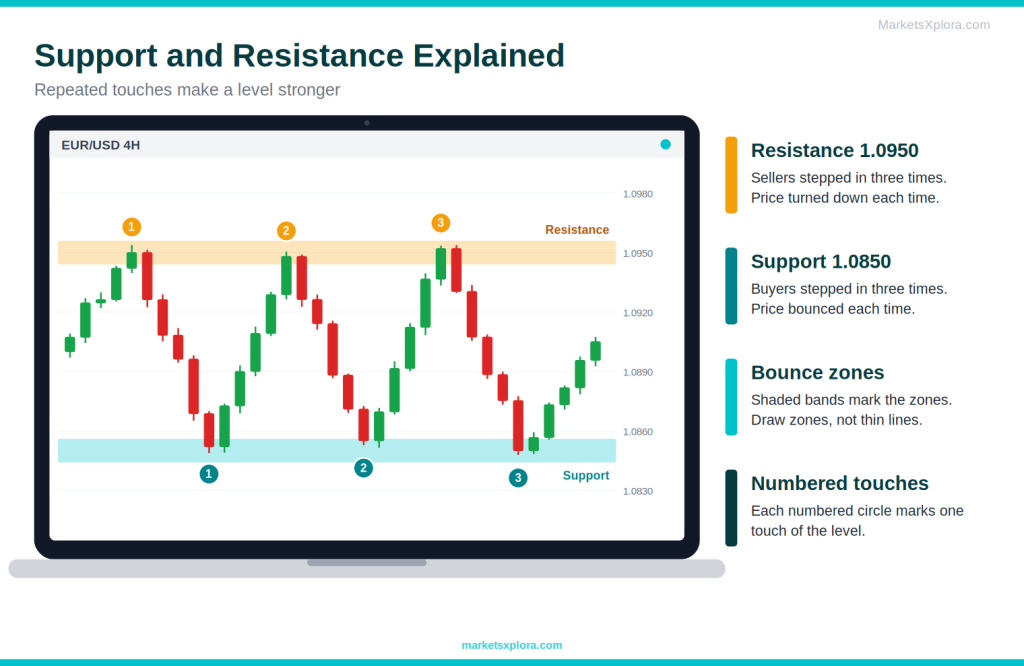
Support is a price area where buyers have stepped in before. When price falls to this area, demand often rises and price bounces. Think of it as a floor.
What is resistance?
Resistance is a price area where sellers have stepped in before. When price rises to this area, supply often rises and price turns down. Think of it as a ceiling.
Why support and resistance matter
These levels reflect market memory. Traders remember where price turned before. So they place orders near the same levels again. That crowd behavior makes the levels useful, even though they never work every time. Also, a broken support often becomes new resistance, and a broken resistance often becomes new support.
How beginners can draw support and resistance
- Start on a higher timeframe, such as the daily or H4 chart.
- Find areas where price turned at least two or three times.
- Draw a zone, not a thin line. Include the wicks and the bodies near the turning points.
- Keep only the clearest levels. Too many lines create confusion.
- Update your levels as new price action appears.
For a deeper guide, see Support and Resistance Explained.
How to Read Candlestick Charts Within Forex Charts
Candles are the building blocks of most forex charts. Here is the short version. For the full guide, read How to Read Candlestick Charts.
Reading a single candle
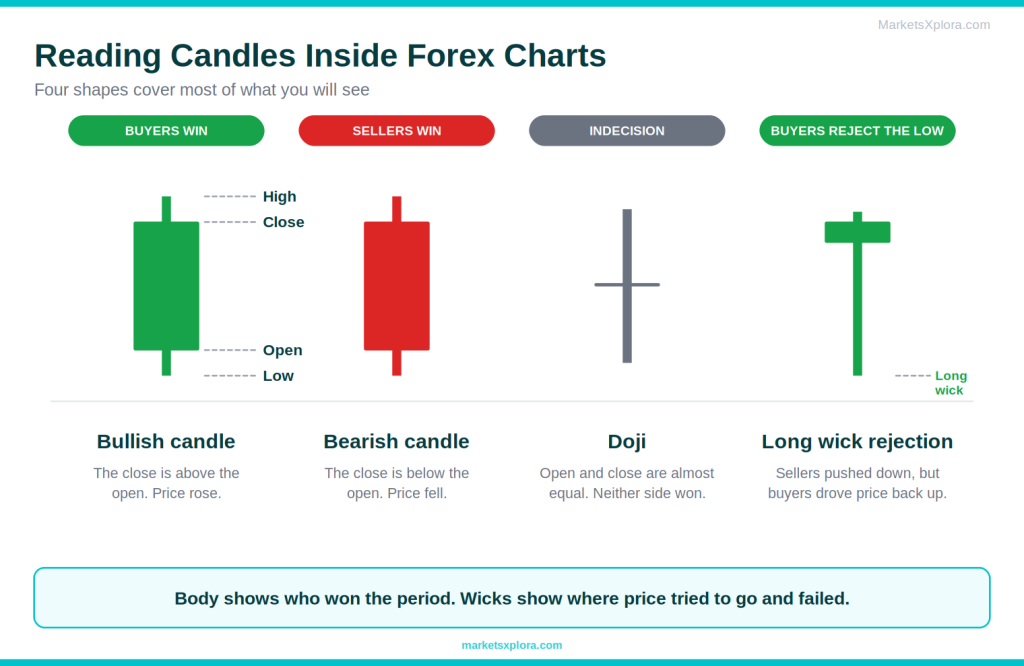
Each candle shows four prices: open, high, low, and close. The thick part is the body. It runs from the open to the close. The thin lines are the wicks. They show the high and the low.
Bullish candles
A bullish candle closes above its open. Price rose during the period. Buyers had control. Platforms often draw it in green or white.
Bearish candles
A bearish candle closes below its open. Price fell during the period. Sellers had control. Platforms often draw it in red or black.
Long wicks
A long wick shows rejection. A long upper wick means buyers pushed price up, but sellers pushed it back. A long lower wick means sellers pushed price down, but buyers pushed it back. Long wicks near support or resistance matter most.
Doji candles
A doji has almost no body, because the open and close are nearly equal. It shows indecision. After a strong move, it can hint that momentum is fading.
How Traders Analyse Forex Charts
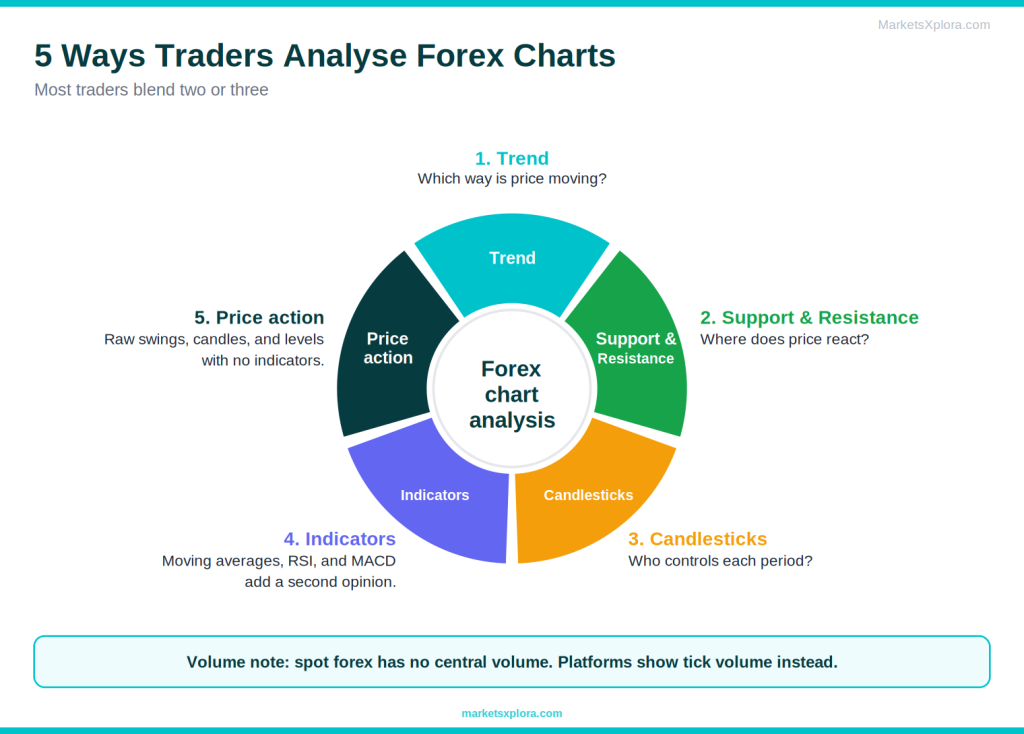
Traders rarely rely on one tool. They combine a few methods to build a case. Here are the main ones. They all belong to a broader approach called technical analysis. To learn more, read What Is Technical Analysis?.
Trend analysis
Trend analysis asks one question: which way is the market moving? Traders then prefer setups that match that direction.
Support and resistance analysis
Here, traders mark the key levels and watch how price reacts near them. A bounce or a break at a level often gives the clearest trade ideas.
Candlestick analysis
Candlestick analysis reads the shapes of candles and short patterns, such as engulfing candles and hammers. These shapes hint at who controls the market.
Indicator analysis
Indicators are calculations drawn on top of or below price. Three are common for beginners:
- Moving averages: the average price over a set number of candles. They smooth price and show trend direction.
- RSI (Relative Strength Index): a momentum gauge from 0 to 100. Traders often watch the 70 and 30 levels as possible overbought and oversold zones.
- MACD: a momentum and trend tool built from two moving averages and a signal line.
Remember that indicators come from price. They lag behind it. Use them to support your reading of the chart, not to replace it. Volume can help too, but spot forex has no central volume figure. Most platforms show tick volume, which counts price changes instead.
Price action analysis
Price action analysis studies raw price movement with no indicators. Traders watch swings, candles, and levels directly. Many traders like it because it keeps the chart clean.
Step-by-Step: How to Read a Forex Chart Like a Trader
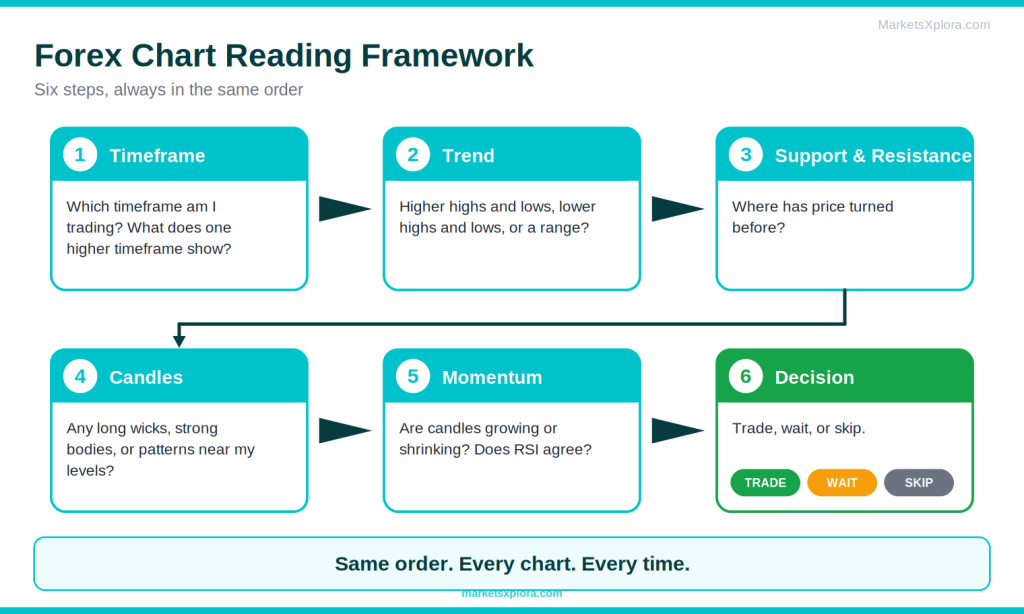
Follow the same order every time. A repeatable process stops you from guessing.
Step 1: Identify the timeframe
Decide which timeframe you are trading, and check one higher timeframe for context. For example, trade on H1 and check the daily chart.
Step 2: Identify the trend
Look for higher highs and higher lows, or lower highs and lower lows. If neither appears, call it a range.
Step 3: Mark support and resistance
Draw the clearest zones where price has turned before. These zones tell you where price may react next.
Step 4: Look at recent candles
Study the last few candles near your levels. Look for long wicks, strong bodies, and patterns.
Step 5: Assess market momentum
Ask whether candles are getting bigger or smaller. Growing bodies show strengthening momentum. Shrinking bodies show momentum fading. An indicator such as RSI can add a second opinion.
Step 6: Wait for confirmation
Do not act on the first signal. Wait for the next candle to support your idea. Then decide: take the trade, keep waiting, or skip it. Skipping is a valid decision.
Real Forex Chart Examples
Example 1: Uptrend analysis
- Chart: EUR/USD on the 4-hour timeframe.
- Trend: Swing lows form at 1.0800, 1.0850, and 1.0900. Swing highs form at 1.0900, 1.0960, and 1.1010. That is a clear series of higher highs and higher lows.
- Reading: Price pulls back to 1.0900, the last higher low. The trend stays intact while price holds above that level.
- Takeaway: A trader looks for buy setups on pullbacks. A close below 1.0900 would weaken the uptrend idea.
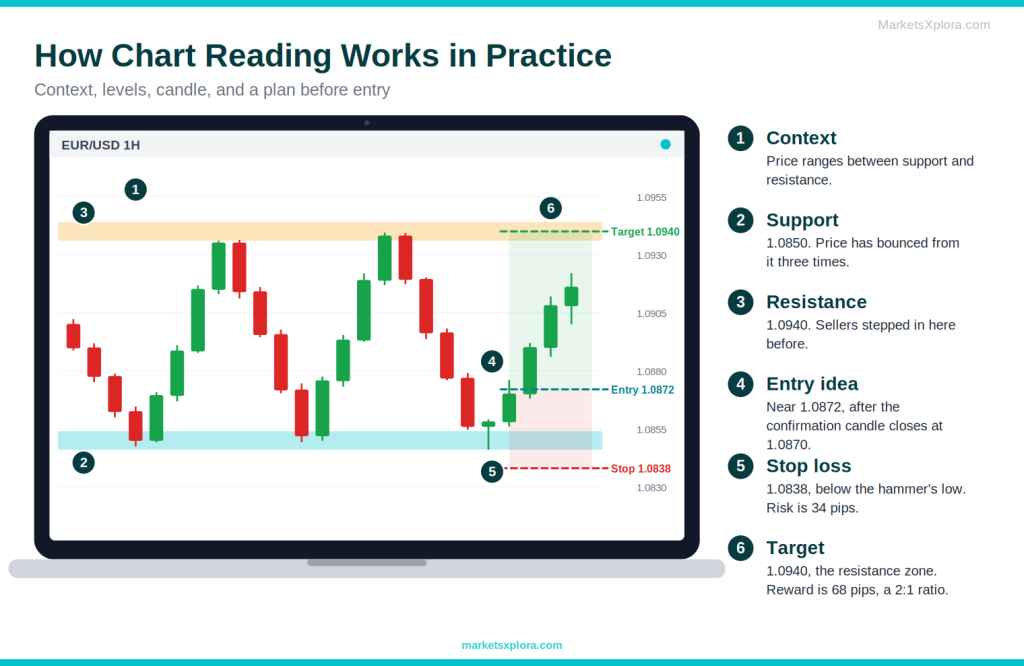
Example 2: Support bounce
- Chart: EUR/USD on the 1-hour timeframe.
- Level: Support sits at 1.0850. Price has bounced from it twice already.
- Candle: On the third touch, a hammer forms with a low of 1.0846. The next candle closes at 1.0870.
- Plan: Enter near 1.0872. Place a stop at 1.0838 (34 pips risk). Target the nearby resistance at 1.0940 (68 pips). The ratio is 2:1.
Example 3: Resistance rejection
- Chart: EUR/USD on the daily timeframe.
- Level: Resistance sits at 1.1050. Price has turned down from it twice.
- Candle: A shooting star forms with a high of 1.1062. The next day closes at 1.1010.
- Plan: Enter near 1.1008. Place a stop at 1.1070 (62 pips risk). Target 1.0884 (124 pips). The ratio is 2:1.
Example 4: Trend continuation
- Chart: EUR/USD on the 4-hour timeframe, in an uptrend.
- Level: Price breaks above resistance at 1.0960. It then pulls back to retest that level, which now acts as support.
- Candle: A bullish engulfing candle forms at 1.0962 and closes at 1.0985.
- Plan: Enter near 1.0985. Place a stop at 1.0935 (50 pips risk). Target 1.1085 (100 pips). The ratio is 2:1.
All four examples follow the same logic. The trader read the trend, marked the level, studied the candle, and planned the risk before entering.
Common Forex Chart Reading Mistakes
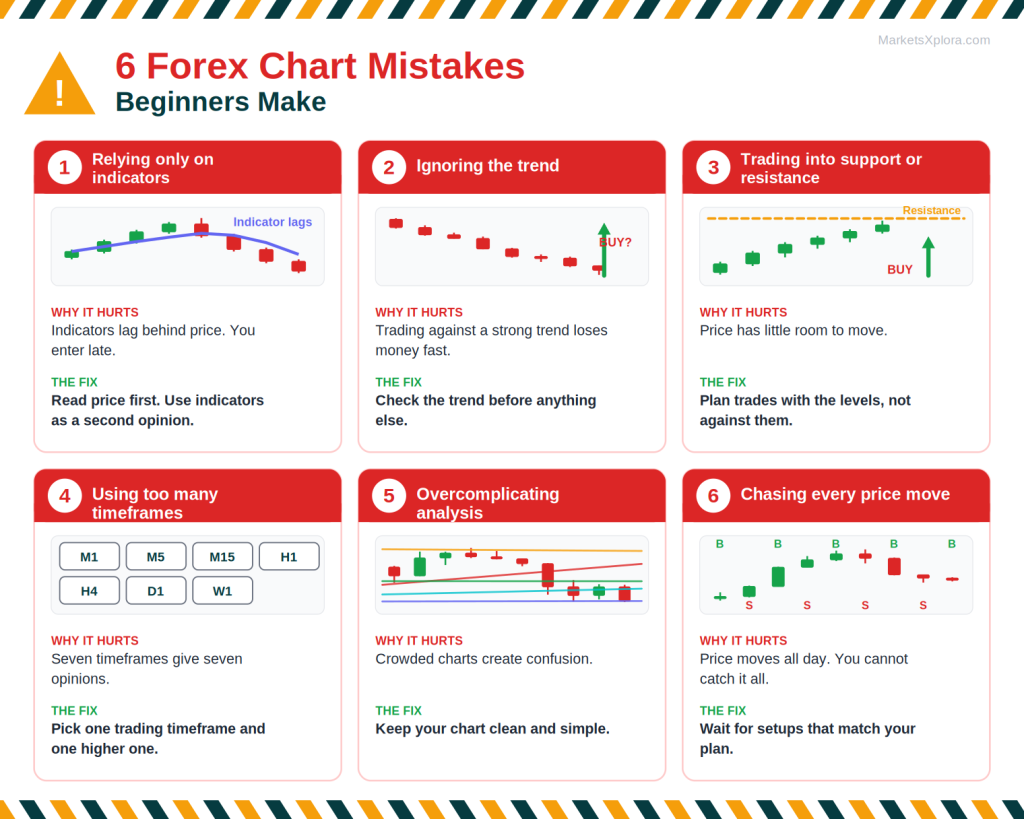
Focusing only on indicators
Indicators lag behind price. A trader who ignores the chart and follows signals alone often enters late.
Ignoring the trend
Trading against a strong trend is a fast way to lose money. Check the trend before you check anything else.
Trading against support and resistance
Buying right into resistance or selling right into support gives price little room to move. Plan trades with the levels, not against them.
Using too many timeframes
Checking seven timeframes gives seven opinions. Pick one trading timeframe and one higher timeframe for context.
Overcomplicating analysis
Charts loaded with indicators and lines create confusion. Keep your setup clean and simple.
Chasing every price move
Price moves all day. You do not need to catch each move. Wait for setups that match your plan, and let the rest go.
Forex Chart Reading Checklist
Run through this list before you analyse any chart.
- ☐ Identify the currency pair
- ☐ Select the timeframe
- ☐ Determine the trend
- ☐ Mark support
- ☐ Mark resistance
- ☐ Review the candlesticks
- ☐ Check momentum
- ☐ Look for confirmation
- ☐ Plan your risk (entry, stop loss, target)
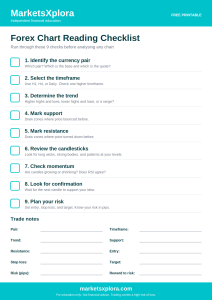
⬇ Download the Forex Chart Reading Checklist (PDF)
Beginner Forex Chart Glossary
Term |
Meaning |
|---|---|
Pip |
The standard unit of price movement. It is 0.0001 for most pairs and 0.01 for yen pairs. |
Lot |
The standard trade size. One standard lot is 100,000 units of the base currency. A mini lot is 10,000. A micro lot is 1,000. |
Spread |
The difference between the bid and the ask price. It is the broker’s built-in trading cost. |
Bid |
The price at which you can sell the base currency. |
Ask |
The price at which you can buy the base currency. |
Trend |
The general direction of price: up, down, or sideways. |
Support |
A price area where buyers have stepped in before and price tends to bounce. |
Resistance |
A price area where sellers have stepped in before and price tends to turn down. |
Bullish |
Expecting or showing rising prices. Buyers are in control. |
Bearish |
Expecting or showing falling prices. Sellers are in control. |
Volatility |
How much and how fast price moves. High volatility means large, quick swings. |
Breakout |
A move of price through a support or resistance level, often with strong momentum. |
Frequently Asked Questions
Final Thoughts
Reading forex charts is not about predicting the future. It is about understanding what the market is doing right now. It is also about spotting patterns that may help you make better decisions.
Start with these five building blocks, in this order:
- Currency pairs
- Timeframes
- Trends
- Support and resistance
- Candlesticks
Practise on a demo account until the process feels natural. Then move into more advanced technical analysis, such as indicators and risk management.
Keep learning
- How to Read Candlestick Charts
- What Is Technical Analysis?
- Support and Resistance Explained
- Best Forex Brokers for Beginners
- Best Day Trading Platforms for Beginners
- Best MT5 Brokers
- Best TradingView Alternatives
About the author
Samson Ononeme is the founder of MarketsXplora, an independent financial education and research platform covering cryptocurrency, forex, brokers, exchanges, trading platforms, and blockchain technology. He has more than 12 years of experience in financial content, with bylines at EarnForex, Kryptomoney, Cryptorunner, and AtoZ Markets. He turns complex financial products into clear, practical information that readers can use when they compare their options. Connect on LinkedIn and X.