
What are the types of Forex analysis? When it comes to predicting the future movements and directions of the Foreign exchange market, there are three important methods:
- Technical analysis
- Fundamental analysis
- Sentiment analysis
Some traders are mainly concerned with technical analysis, while others prefer fundamental or sentimental analysis. It is good to know something about these types of analysis in Forex, to gain knowledge and insight, and even to experiment with them.
In this article, we will explain these techniques as well as the tools investors use to identify market opportunities. The more you know about these types of Forex analysis, the more profitable trades you will be able to place.
3 types of Forex analysis
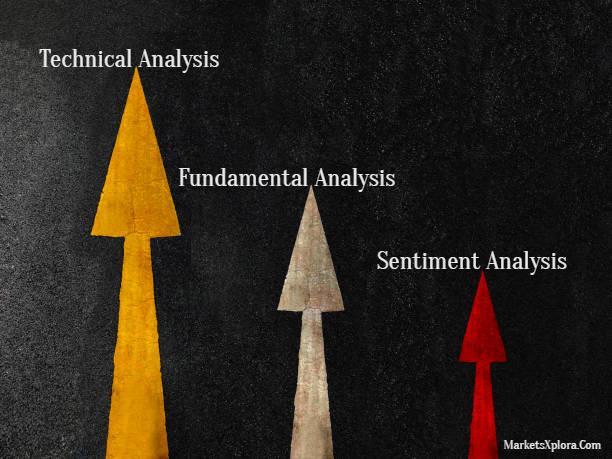
We distinguish below the three different types of analysis:
1# What is technical analysis?
Technical assessment is an interesting option for all those who want to invest in the Foreign exchange market. Technical analysis is defined as the technique used by many traders to predict the future trend of prices, through the use of tools on a price-time chart.
Technical analysts look at patterns that can be recognized over a certain period. When one has found such a pattern, it is usually easy to predict the best time to trade. So technical analysis deals with data from the past and tries to determine patterns based on that data.
For example, a trend reversal can be understood as the transition from a bullish movement to a bearish one or vice versa.
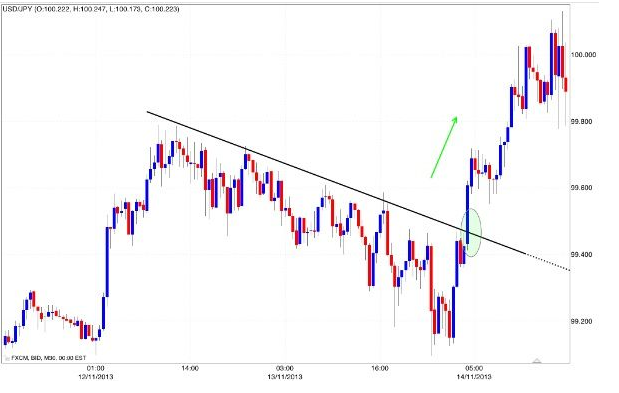
As you can clearly see in the chart above, we have an example of a trend reversal, from bearish to bullish. If this trend is recognized in its initial phase, it can be followed to gain both in the short term and in the long term.
The key to being able to make profits is therefore to be able to understand the weakening of a trend and, therefore, prepare to exploit a reversal.
Now that you understand what is technical analysis in Forex, let’s talk about the tools that can be used for market evaluation.
Technical analysis tools
 When analyzing the financial markets, analysts, traders, and investors make speculations by relying on two primary tools: charts and indicators. Charts provide a visual representation of price and volume data. Indicators, on the other hand, are tools used to analyze the information presented in the charts. Together, charts and indicators form the foundation of technical analysis.
Now let’s see some of these technical analysis tools:
- Moving average convergence divergence (MACD): This is one of the most used tools by investors who want to identify the direction of the trend and its strength. It consists of two lines, a signal line and a MACD line that moves above and below the signal line. When the two lines cross the zero value, if they go up they generate a buy signal which confirms the strength of the uptrend; conversely, if they go short, they provide a sell signal.
- Relative Strength Index (RSI): This popular technical indicator is used to find the moments in which a given currency pair is overbought or oversold. Unlike the MACD, this indicator is based on a single line, which generates a numerical value between 0 and 100. When the RSI is above 70, it suggests that the market is overbought, meaning that prices may have risen too far and a potential reversal or correction could occur. Conversely, when the RSI is below 30, it indicates that the market is oversold, suggesting that prices may have dropped too much and a potential upward reversal or bounce may happen.
- Fibonacci: Invented by Leonardo Fibonacci in the 13th century, the Fibonacci tool is a popular analysis tool used by traders to determine potential support and resistance levels. The Fibonacci tool is applied by drawing horizontal lines on a price chart based on the Fibonacci ratios. These lines, known as Fibonacci retracement levels, help identify potential support and resistance areas where price reversals or significant price movements may occur.
- Ichimoku: The Ichimoku indicator, also known as the Ichimoku Kinko Hyo, is a well known analysis tool that originated in Japan. This tool is made up of several lines, including the cloud, conversion line, and baseline that can be used in identifying buying and selling opportunities and in determining trend direction. With the Ichimoku indicator, you can assess market support and resistance levels.
- Moving Averages: This is the easiest technical analysis tool that can be used to determine the direction and strength of a trend. It helps traders identify the average price of a currency pair over a specific period of time, such as 10 days or 50 days. When a price of a currency pair is below the moving average, it is interpreted as a buy signal, when it is above the price it is interpreted as a sell signal. This is because the price tends to move away from and approach the average with a certain frequency.
- Bollinger Bands: Bollinger Bands are a volatility indicator created by John Bollinger, a well-known financial analyst and author. This widely used analysis tool tells investors how much volatility there is currently in the market. The Bollinger Bands consist of a moving average line in the middle and two bands, an upper band and a lower band, that are positioned above and below the moving average. Traders use this tool to identify overbought and oversold levels of an asset and to determine possible entry and exit points. They are not meant to be an indicator that generates buy and sell signals.
- Stochastic Oscillator: This popular tool is used in measuring price momentum and helps in identifying potential overbought or oversold conditions. It is based on the comparison between the current closing price and the highest and lowest prices of a given period. The most commonly used period is 14, meaning the calculations are based on the past 14 periods.
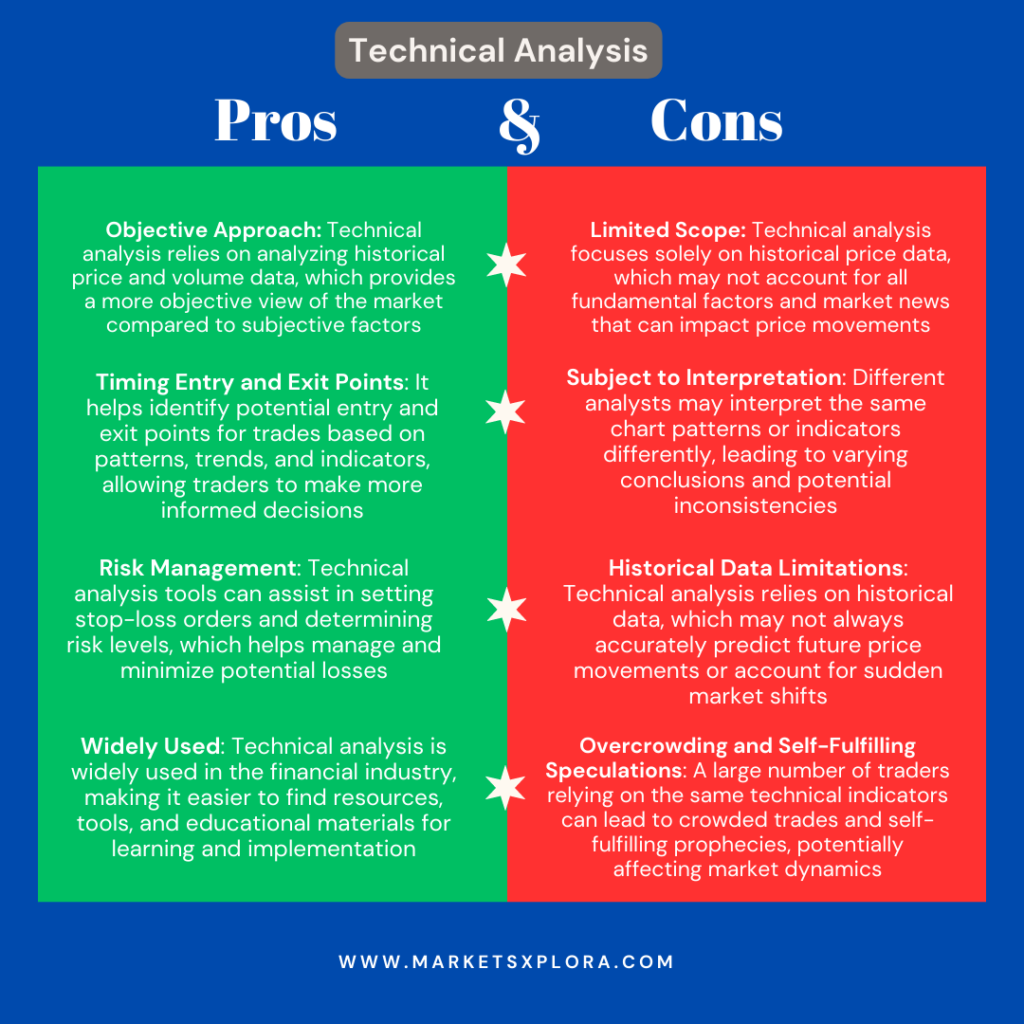
Pros and cons of technical analysis
2# What is fundamental analysis in Forex?
Fundamental analyses deal with favoring the economic aspects of currencies by looking at them from a purely financial point of view. Economic news, for example, is analyzed to try to make predictions.
For this reason, every good fundamental analyst should keep the economic calendar at hand with all the deadlines, starting from the political meetings in the U.S. and Europe up to the announcements from banks such as the ECB or the Federal Reserve. However, it is advisable to keep the Asian markets under control as well.
What happens at these events? It happens that currencies inevitably undergo fluctuations. For example, a currency becomes stronger when interest rates rise. This is because those investing are more likely to buy it as well as traders. In general, they prefer to trade where they get the best rate, wherever in the world they are.
A trader who trades according to these principles likes trading more long-term by looking at data even for days or weeks. It is obviously advisable to act in this way if you have a wealth of experience.
Fundamental analysis tools
 By making use of the following fundamental analysis tools, you aim to understand the main market trends and make predictions about future price movements in the FX market.
- Economic Calendar: To thrive as a trader, you will definitely need an economic calendar that lets you know on what day important events will occur, such as interest rate announcements, employment reports, Nonfarm Payrolls, presidential elections, speeches by the head of the bank, etc. You can use this tool to stay updated on relevant events as they can influence the prices of currency pairs.
- Economic Indicators: Various indicators, such as employment figures, inflation rates, industrial production, and retail sales, provide insights into the health and performance of an economy. Investors analyze these indicators to gauge the strength or weakness of a currency.
- A trading journal: This special trading diary is a very important tool as it helps you keep track of all your trading activities. In the trading journal, you can write down details about the currency pair you bought or sold, how much money you used, and at what price you executed the trade. The trading journal is important because it helps you learn from your past mistakes and become more effective when trading over time.
- News Sources: Traders rely on various news sources like financial news websites like marketsxplora.com to gather information about significant events, policy changes, geopolitical developments, and monetary indicators. The publication of financial news informs those trading about these important events that can directly or indirectly affect the Forex market.
Pros and cons of fundamental analysis
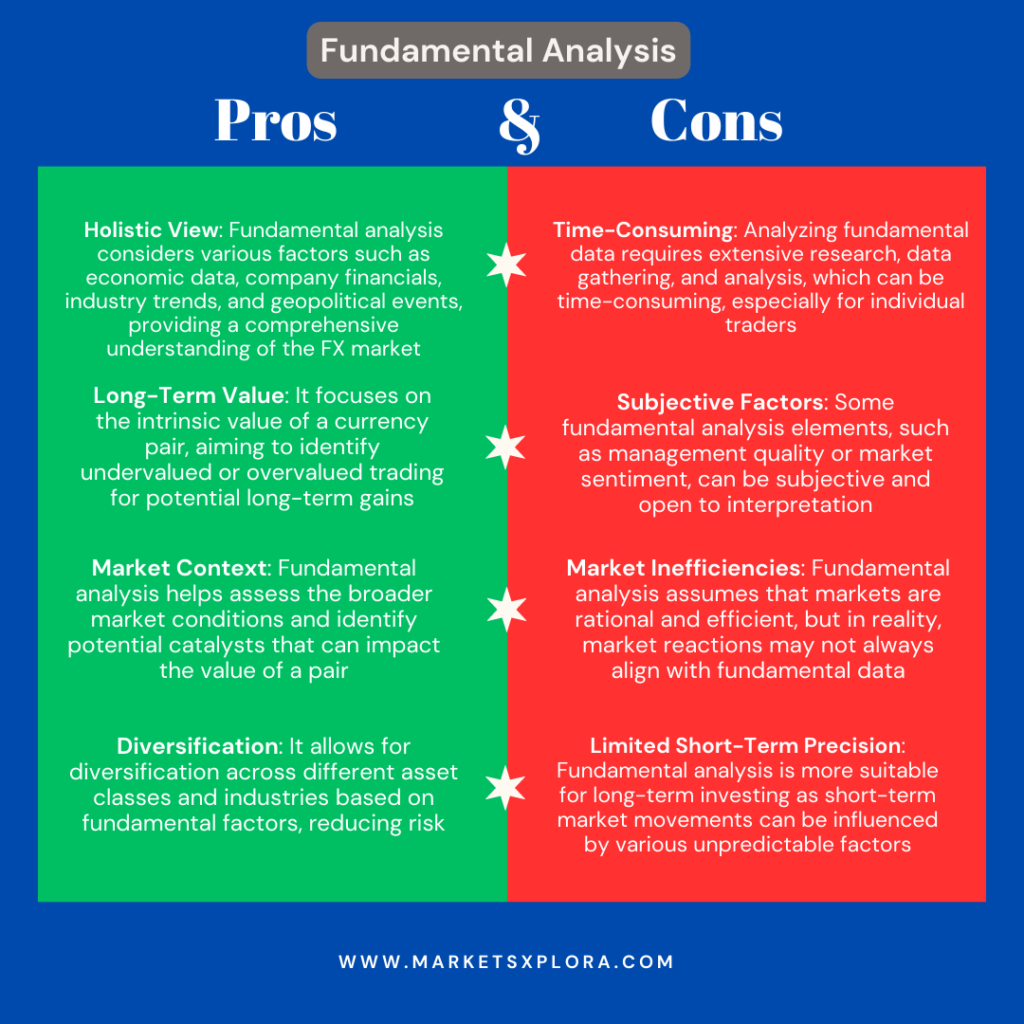
Of course, it is worth considering fundamental factors, but it is risky to rely only on them when making a trading decision. Experience shows that those traders that combine both elements of technical and fundamental analyses achieve the greatest success.
3# What is sentiment analysis in Forex?
Sentimental analysis is a way to gauge how people feel about something. It can be used to understand the general sentiment around a given topic. It is a branch of data science that analyzes people’s emotions, opinions, and attitudes. This can be used to find out how a group feels about certain issues.
When it comes to Forex, it is essential to understand what sentimental analysis is and how you can use it to your advantage. By analyzing the markets and trader sentiment, you can predict future market trends and make better-informed decisions about where and when to place trades.
Forex market sentiment indicates the general attitude of traders towards a particular currency (such as the US dollar) or currency pair (such as the EURUSD). It is the crowd psychology of a Forex market, its tone or sentiment, as displayed through the activity and price movement of the pair.
Now that we have answered the question of what is sentiment analysis in Forex trading, let’s take a look at the tools that can be used for Forex sentimental analyses.
Forex sentiment analysis tools
Below are the main FX sentiment analysis tools:
- Commitment of Traders (CoT Report): Also known as the Traders Commitment, this is a weekly report released on Fridays. The Commodity Futures Trade Commission (CFTC) is in charge of its dissemination. The CoT report details the number of positions that have been opened in the futures market. It should be noted that the futures market is not the same as the cash market. However, it does give us a fairly accurate picture of what will happen to the various currency pairs. In short, it expresses the sentiment of the Forex market.
- AAII Investor Sentiment Survey: This is an online survey carried out on individual who are investing in the FX market. One thing I find interesting about this market sentiment tool is that the big investors take it as a contrary opinion. Let’s be clear, if the survey says a pair will trade lower, traders consider going long. The analysts start from the base that the little knowledge of the individual investors shows a distorted vision of what happens. Therefore, they choose trading contrary to what the result of the AAII Investor Sentiment Survey indicates. This survey is conducted every week. It can return three possible outcomes: bullish, bearish, and neutral.
- Volatility Index (VIX): This is a sentiment analysis tool that refers to the implied volatility in large option trades in the S&P 500. From this data, it can be concluded how it will affect the Foreign exchange market. Recall that the Volatility Index is provided by the Chicago Board Options Exchange (CBOE). Therefore, it is considered one of the sentiment analysis tools of the Forex market. An increase in volatility reflects a mood among traders who are moving with some anxiety.
Read also: Who Controls the Forex Market?
It is important to note that these three sentiment analysis tools we’ve just mentioned are not a buy or sell signal. You should wait for the trend to consolidate before taking action.
Therefore, we can say that the Forex sentimental analysis is an excellent complement to technical and fundamental analysis. These 3 types of Forex analysis, acting together, can give us a fairly accurate picture of the currencies we wish to trade.
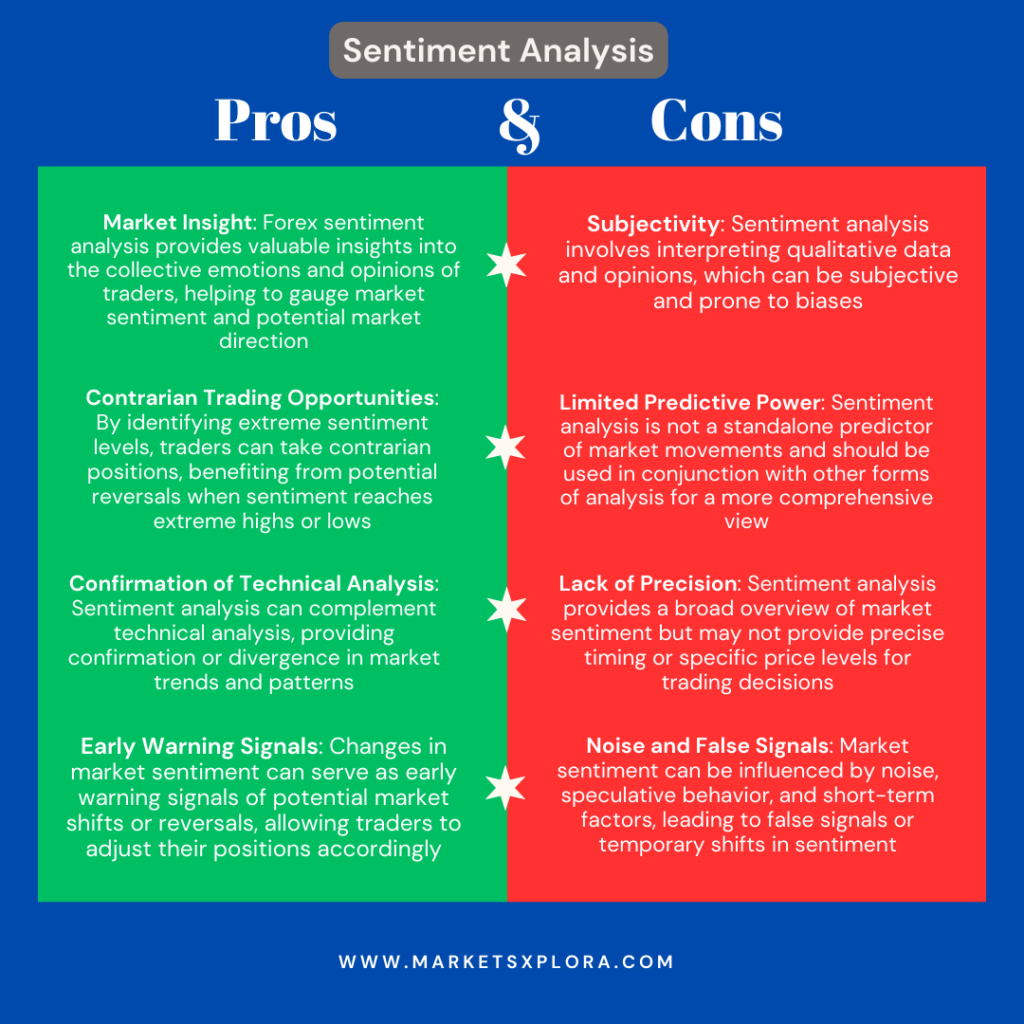
Pros and cons of sentimental analysis
What are the best Forex analysis sites?
For the ultimate FX trading news experience, we compiled a 2023 list of the 8 best Forex analysis websites:
- FXStreet: Keep a daily tab on this website, as it truly stands as the epitome of the best Forex analysis sites. FXStreet publishes a multitude of articles throughout the day, with topics spanning from major to minor pairs and encompassing economies worldwide.
- DailyFX: This website stands out for its quality FX news with an exceptional team of writers and market analysts. So whether you’re seeking the latest market updates or in-depth daily Forex analysis, DailyFX offers a comprehensive range of articles and reports to satisfy your trading needs.
- TradingView: This is the go-to destination for every FX trader. This platform offers beautifully designed, free trading charts, live Forex analyses by experts, and a wealth of trading knowledge at your fingertips.
- FXEmpire: This site offers valuable Forex analysis forecasts and news articles. FX Empire covers not only FX but also other financial instruments such as equities, indexes, and commodities.
- Forex Factory: This is a one-stop website that provides valuable insights into the Forex market. The website highlights news based on their impact on the market, making it easier to stay informed.
- Investing.com: Investing.com covers the Forex market extensively and also provides live charts that offer important events and candlestick patterns.
- Forexlive: Forexlive publishes short news articles and offers a section for the types of Forex analysis we’ve discussed. This website provides essential statistics, charts, and data for traders. It is a valuable source for staying updated on market events.
- Action Forex: This website covers major and minor currency pairs and provides a weekly outlook report. Action Forex emphasizes technical analysis and offers insights into market directions.
Conclusion – Which are the best types of market analysis?
This is the million-dollar question for traders who are just starting out in the Foreign exchange market. As you progress through the exciting world of the Forex market, you will find strong tendencies, especially toward technical or fundamental Forex analysis.
You will find some investors who argue that fundamental assessment is better and that any pattern found on the chart is purely coincidental. Conversely, you will find people who claim that technical analysis is the best.
Don’t be fooled by these opinions. Neither type of Forex analysis technique is actually better than the other! To become a successful trader, you will need to know how to effectively use all 3 types of Forex analysis.
Focusing on just one type of analysis and ignoring the others can lead to disaster.
So, the best advice we can give you is not to make a choice but to use all three Forex analysis techniques to build a picture of what will be the best options for you to take.
FAQs
Do you recall?
- What are the three types of market analysis?
They are technical analysis, fundamental analysis, and sentiment analysis. Technical analysis in forex is one of the most preferred types of analysis.
- What is Technical analysis?
Put simply, this type of analyses involves studying price charts and using various tools and indicators to predict future price movements.
- What are the tools of technical analysis?
Charts and indicators are the primary tools used in technical analysis. Examples of the best technical analysis tools for trading are Moving averages, Relative Strength Index (RSI), Fibonacci retracement levels, Bollinger Bands, Stochastic Oscillator.
- What is fundamental analysis?
This type of analysis focuses on analyzing economic factors and news events to determine the intrinsic value of a currency.
- What tools are used in fundamental analysis?
Economic calendar, economic indicators, trade journals, news sources, etc.
- What is sentiment analysis in Forex trading?
Sentiment analysis measures the general sentiment or mood of traders in the market. This type of analysis helps in identifying overbought or oversold conditions and potential reversals.
- What tools are used in sentiment analysis?
Commitment of Traders (COT) report, AAII Investor Sentiment Survey, Volatility Index (VIX).