
Key Insights
- EUR/USD is trading within a Symmetrical Triangle formation on the daily chart, indicating consolidation and potential volatility contraction.
- The pair remains below the 200-day EMA (1.0790), suggesting an overall bearish trend, with immediate resistance at the 20-day EMA (1.0740).
- The RSI oscillating between 40-60 reflects market indecision, while a break below triangle support could target 1.0600, and a move above 1.0790 could shift the bias bullish.
The EUR/USD pair remains under pressure in Tuesday’s European session, trading slightly above the 1.0700 mark as market participants digest the latest economic data and central bank commentary.
The Euro’s weakness can be largely attributed to the softer-than-expected inflation figures from the Eurozone. The preliminary Harmonized Index of Consumer Prices (HICP) for June showed a deceleration to 2.5% year-on-year, down from May’s 2.6%. Core HICP, which excludes volatile components, also eased to 2.8% from 2.9% previously. This slowdown in price pressures could potentially pave the way for the European Central Bank (ECB) to adopt a more dovish stance in the coming months.
Adding to the Euro’s woes, Monday’s German HICP report for June revealed a sharper-than-anticipated softening in inflation, fueling speculation about potential back-to-back rate cuts from the ECB. However, ECB President Christine Lagarde has maintained a cautious tone, emphasizing the need for more time to gather sufficient data before making decisive policy moves.
On the political front, uncertainty surrounding France’s upcoming second-round runoffs on July 7 is keeping Euro bulls on edge. Exit polls from the first round suggest Marine Le Pen’s far-right National Rally (RN) is in a strong position, albeit with a smaller margin than initially projected.
Meanwhile, the US Dollar has found some support despite mixed economic signals. The ISM Manufacturing PMI unexpectedly declined in June, while inflationary pressures in the manufacturing sector grew at a significantly slower pace than expected. However, the Dollar Index (DXY) has rebounded sharply, approaching the 106.00 level.
Investors are now keenly awaiting Fed Chair Jerome Powell’s speech and the JOLTS Job Openings data for further clues on the Federal Reserve’s policy trajectory. Current market expectations are pricing in two rate cuts this year, starting from September, which is more aggressive than the Fed’s latest projections.
EURUSD Technical Analysis” pair remains below the 200-day EMA
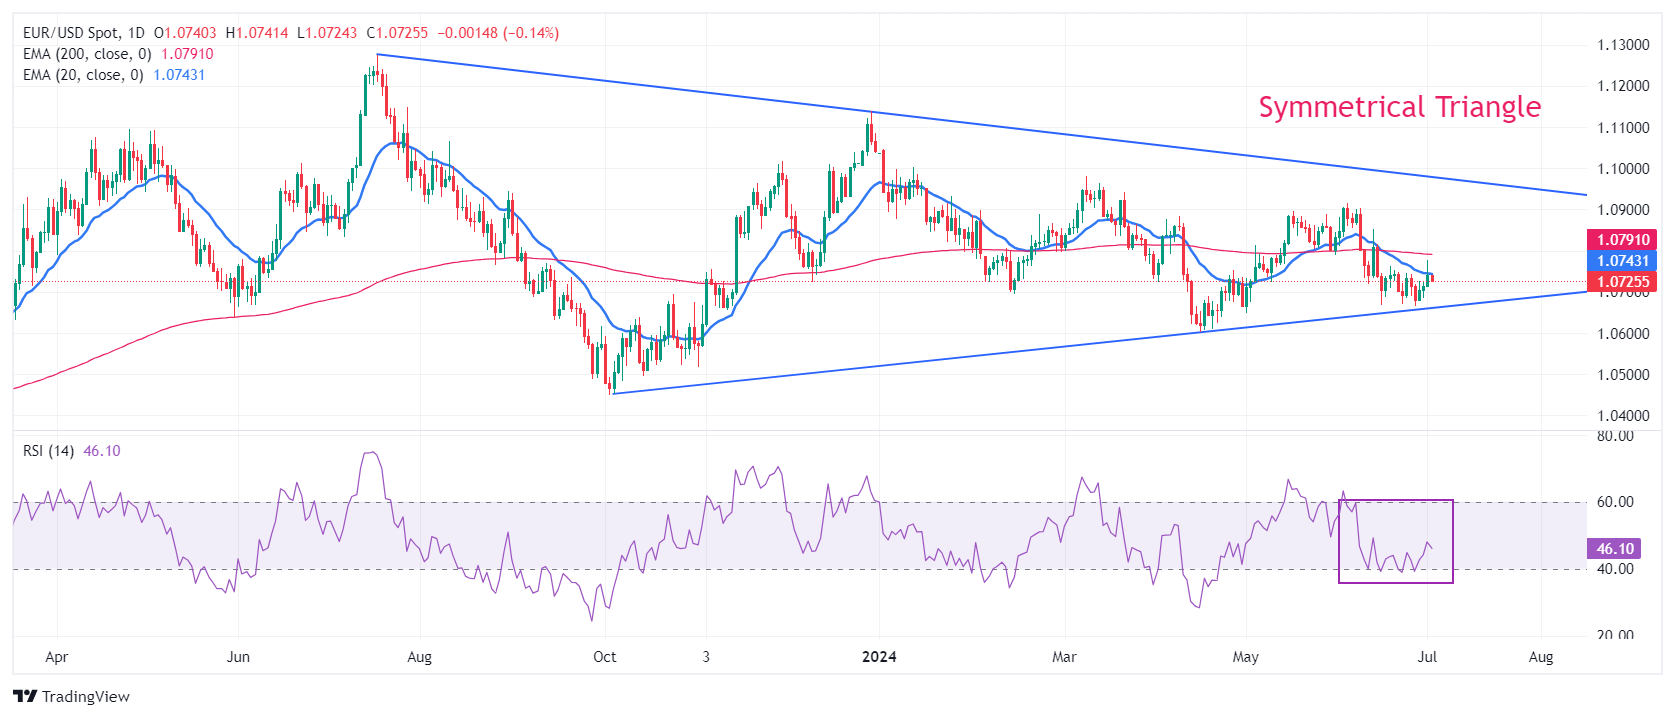
Turning to the technical picture, EUR/USD is showing signs of weakness as it struggles to maintain ground above the 1.0700 handle. The pair’s recent failure to hold above the 20-day Exponential Moving Average (EMA) at 1.0740 suggests that bearish sentiment is gaining traction.
On the daily timeframe, EUR/USD remains confined within a Symmetrical Triangle formation. This pattern, characterized by converging trend lines, indicates a period of consolidation and potential volatility contraction. The lower boundary of this triangle, drawn from the October 3, 2023 low at 1.0448, provided significant support last week near 1.0666. The upper limit extends from the July 18, 2023 high at 1.1276.
A crucial technical factor weighing on the pair is its persistent trading below the 200-day EMA, currently situated around 1.0790. This positioning below such a significant long-term moving average underscores the overall bearish bias in the pair’s trend.
The 14-period Relative Strength Index (RSI) is oscillating between 40 and 60, reflecting a lack of clear directional momentum and indecision among market participants. This neutral RSI reading aligns with the pair’s recent consolidation within the Symmetrical Triangle.
Looking ahead, a decisive break below the triangle’s support could accelerate downside momentum, potentially targeting the psychologically important 1.0600 level. Conversely, a move above the 20-day EMA at 1.0740 could see the pair challenge the 200-day EMA at 1.0790, a break above which would be needed to shift the near-term bias to bullish.