

Key Insights
- GBP/USD trades around 1.2875, supported by a weaker USD and Fed rate cut expectations
- 4-hour chart shows bearish outlook with RSI below 50, but uptrend possible above 100-period EMA
- Key resistance at 1.2919 and 1.2990-1.3000; support levels at 1.2843 and 1.2777
The GBP/USD pair is showing strength around 1.2875 in early European trading, primarily driven by a weaker US Dollar. This weakness stems from growing expectations of a Federal Reserve rate cut in September, providing support to the pair. However, market participants are keenly awaiting the Fed’s interest rate decision on Wednesday, although no change is anticipated.
Read also! Best Time to Trade GBPUSD
GBP/USD Technical Anaylsis
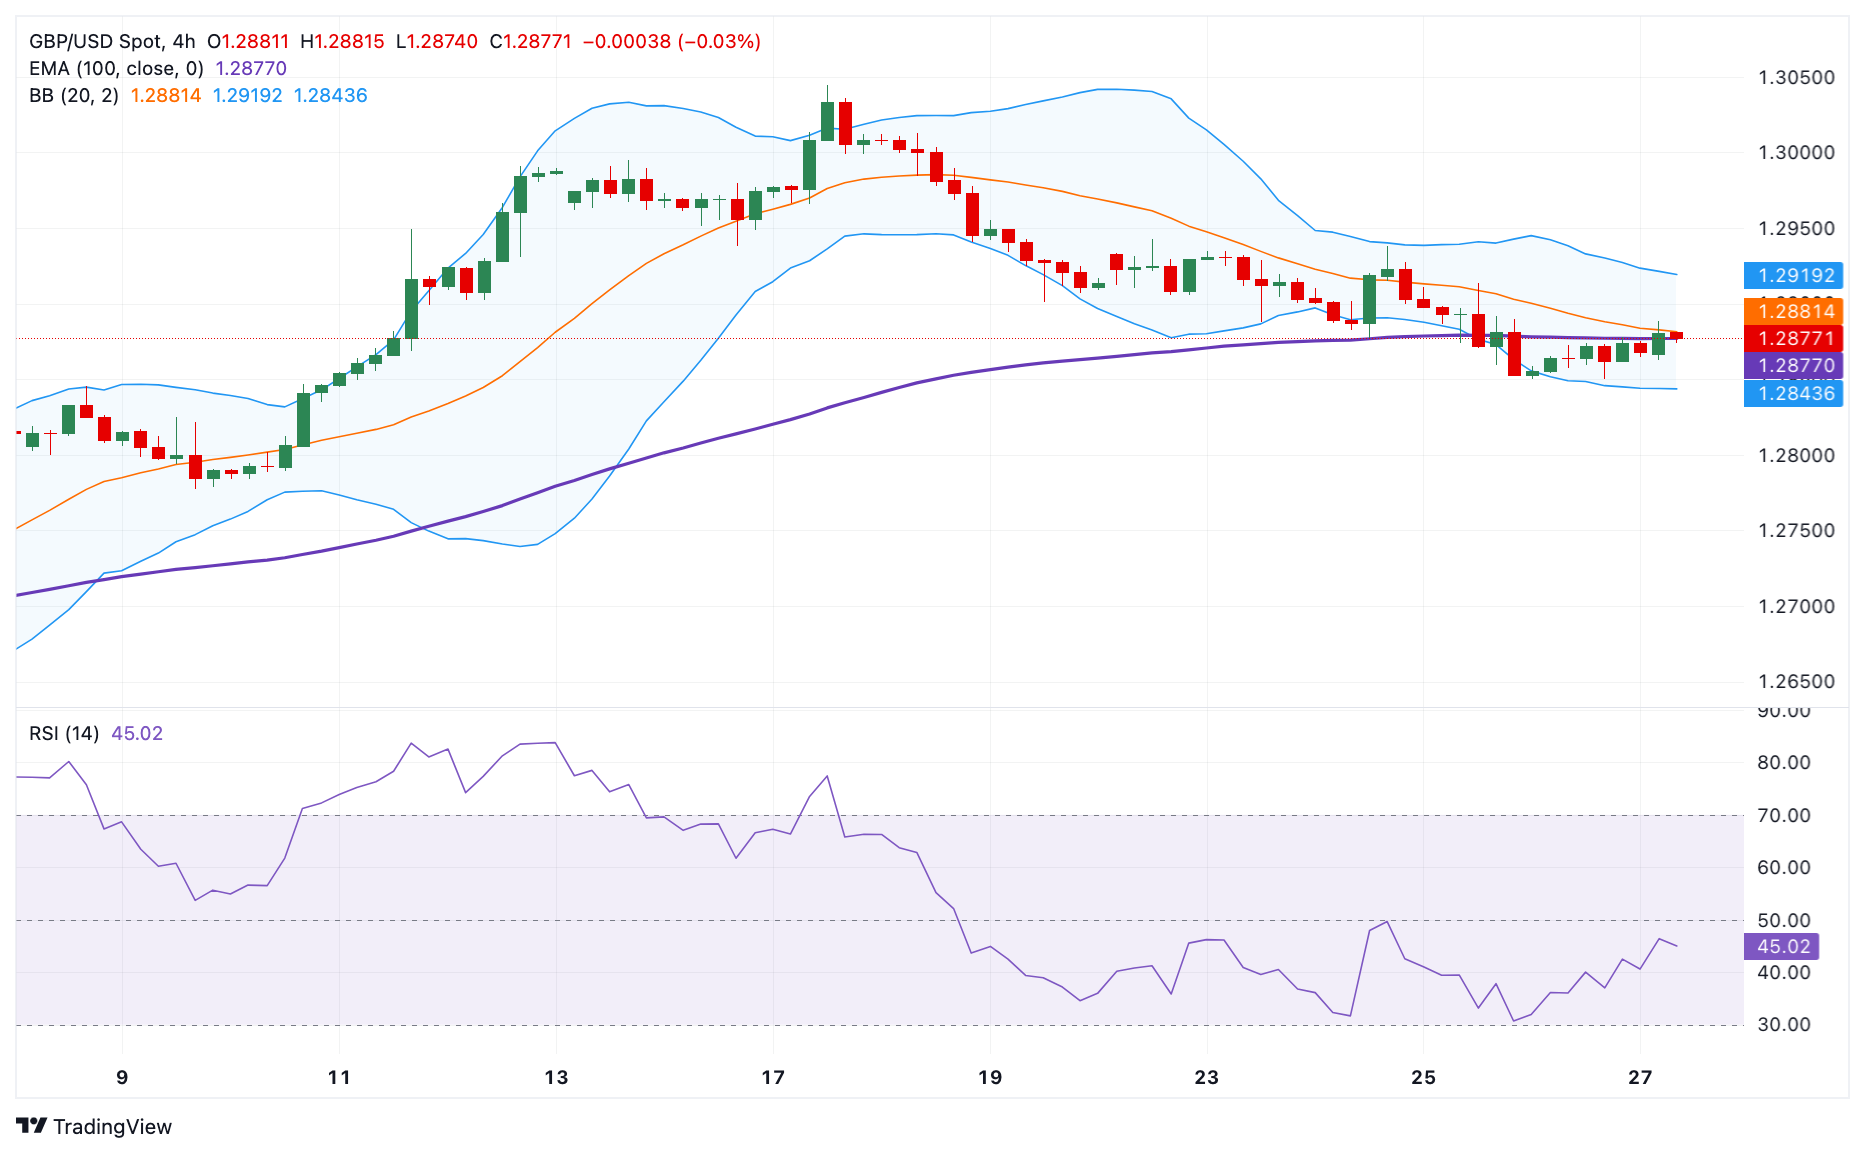
Moving to the technical analysis, the 4-hour chart presents a bearish outlook for GBP/USD. The Relative Strength Index (RSI) remains below the 50 midline, suggesting that downside momentum may continue. Nevertheless, the pair could resume its uptrend if it decisively breaks above the key 100-period Exponential Moving Average (EMA).
Resistance levels are clearly defined for the pair. The upper Bollinger Band at 1.2919 serves as the immediate resistance. A breakthrough here could open the path to 1.2938, the July 24 high. Further upside movement might target the crucial 1.2990-1.3000 zone, which encompasses the July 12 high and a significant psychological level.
On the downside, support levels are equally important. The lower Bollinger Band at 1.2843 acts as the first support. If breached, the pair could slide to 1.2777, the July 9 low. Should selling pressure intensify, the next significant support lies at 1.2739, marking the July 4 low.