Key Insights
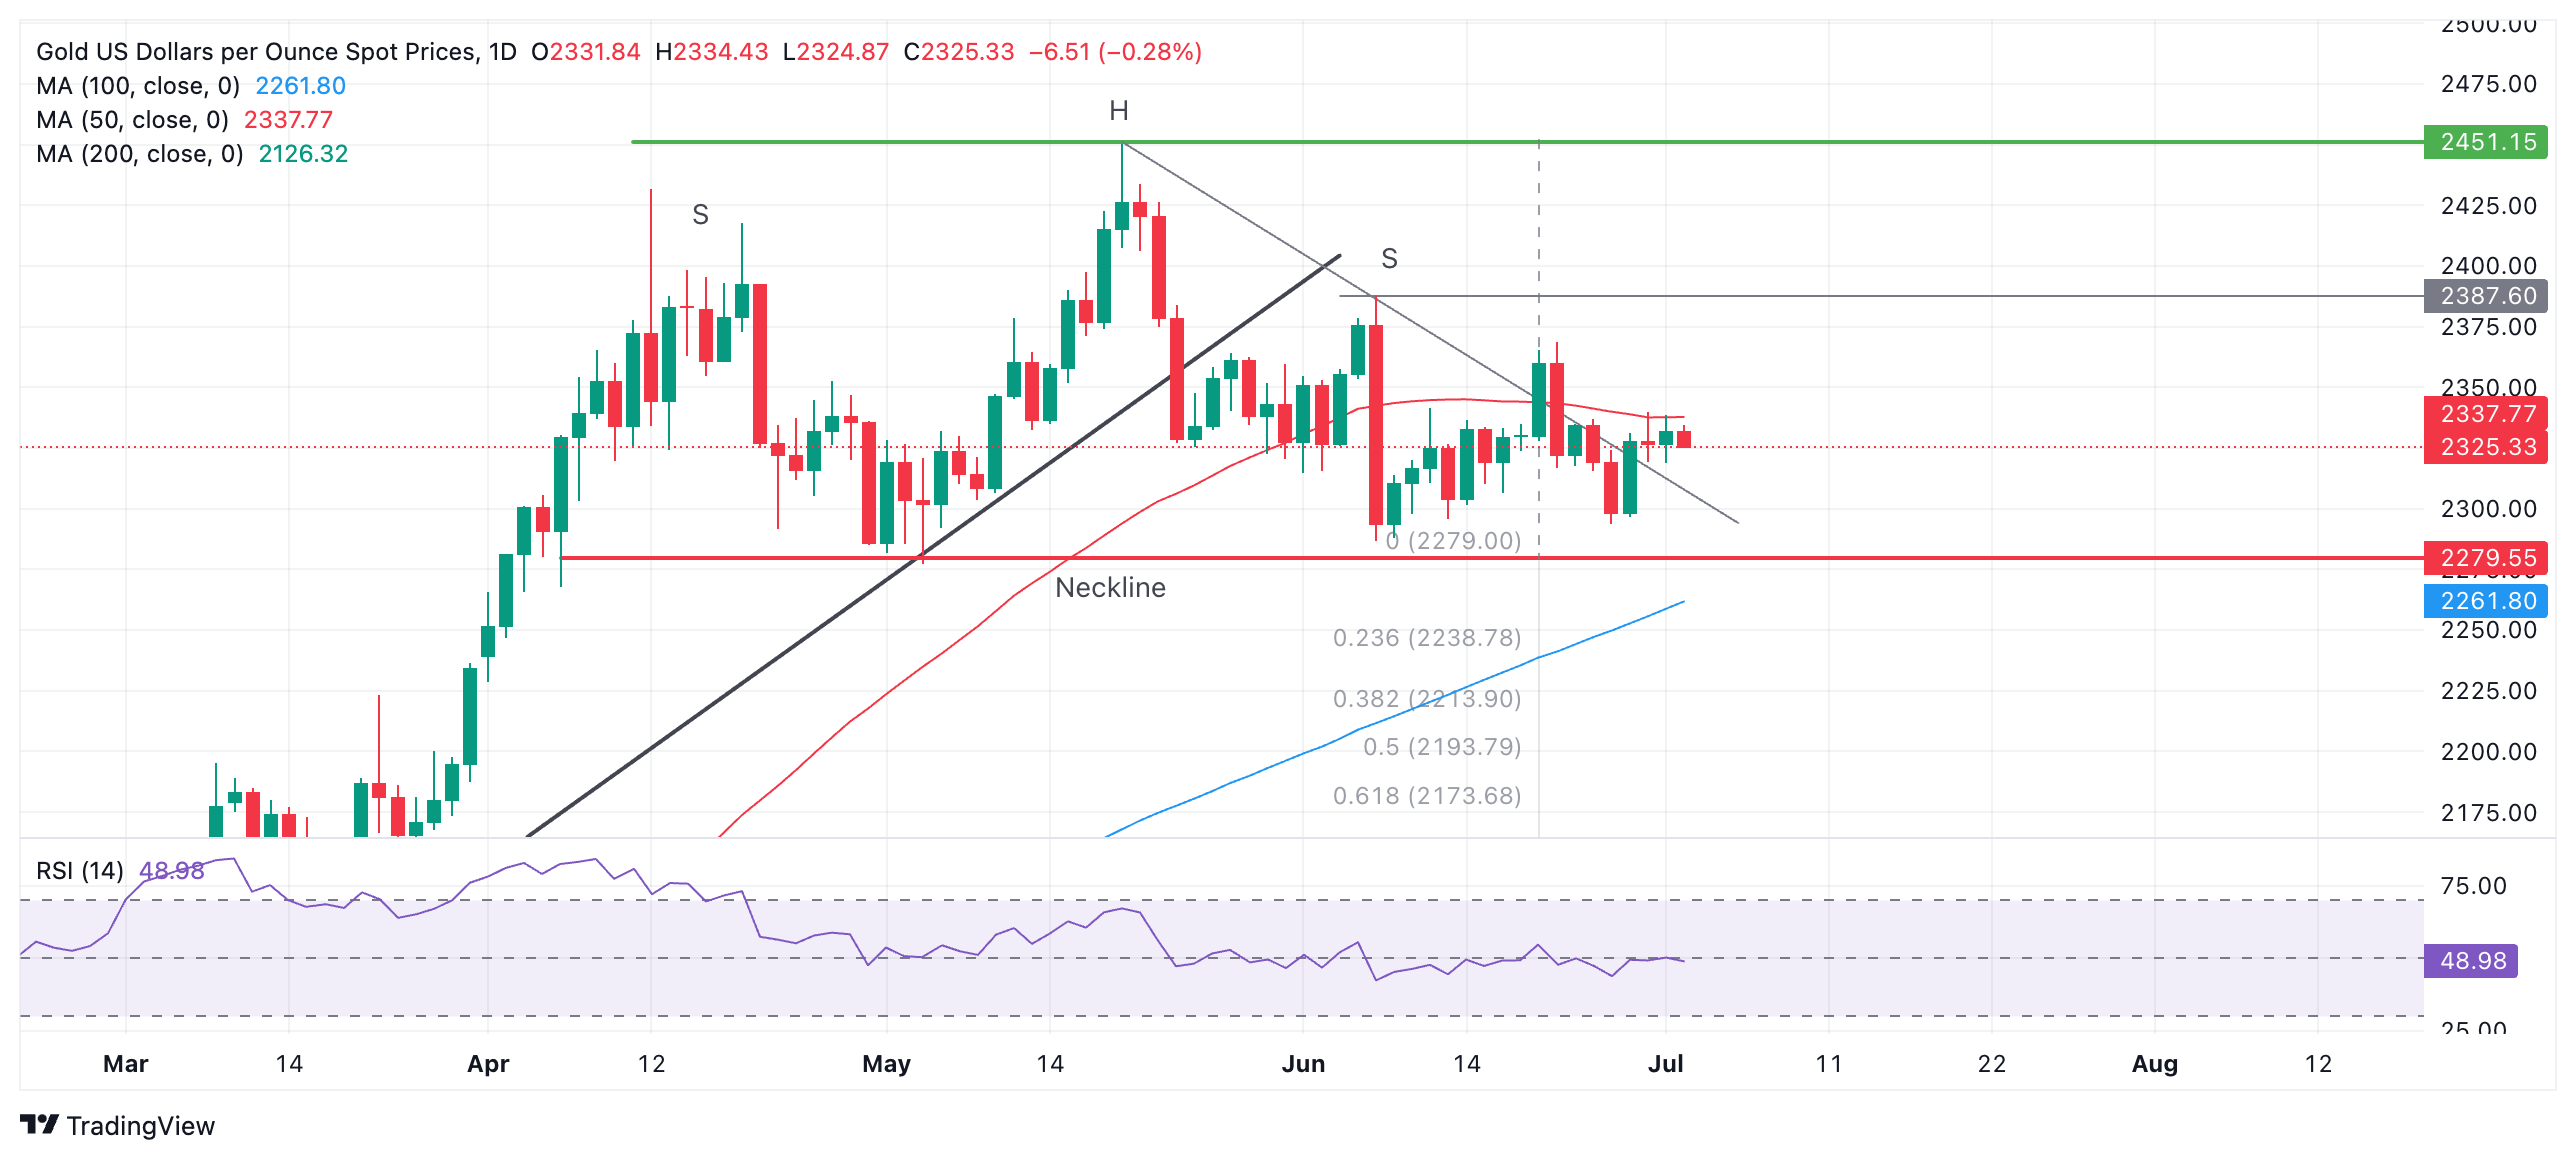
- Gold is trading below the 50-day SMA, with the recent break above the H&S trendline invalidating the bearish pattern.
- Key upside targets are $2,369 and $2,388, while a break below $2,279 could trigger a correction towards $2,171.
- The short and medium-term trends are sideways, but the long-term uptrend remains intact.
Gold Fundamental Outlook
Gold (XAU/USD) continues to trade within a narrow range of $2,320-$2,330, just below the 50-day Simple Moving Average (SMA), as the market digests a complex array of global factors. This consolidation phase is characterized by short-covering from futures traders and bargain hunting by long-term investors, potentially setting the stage for another rally.
The precious metal’s appeal as a safe-haven asset remains strong, supported by ongoing geopolitical tensions in the Middle East and Ukraine, a rightward political shift in Europe, and growing divisions between Eastern and Western economic blocs. The expansion of the BRICS trading confederation further underscores gold’s role as a potential alternative to US Dollar dominance in an increasingly fractured global economic landscape.
However, the Federal Reserve’s reluctance to commit to a specific timeline for interest rate cuts is keeping gold’s upside potential in check. As a non-yield-bearing asset, gold’s opportunity cost remains high in the current high-interest-rate environment. The market is closely watching for signals from the Fed, with the CME FedWatch tool indicating a 65% probability of a rate cut by or before September.
Recent economic data, including the lower-than-expected US ISM Manufacturing PMI, have had limited impact on gold prices. Even the rise in US Treasury yields, attributed to increased chances of a Trump victory in the upcoming presidential election, failed to significantly pressure gold, possibly due to the counterbalancing effect of geopolitical risk associated with such an outcome.
Investors are now turning their attention to Fed Chair Jerome Powell’s upcoming speech and crucial US jobs data, including JOLTS Job Openings and Friday’s Nonfarm Payrolls report. These events could provide fresh insights into the Fed’s policy trajectory and potentially catalyze a breakout in gold prices.
XAUUSD Technical Analysis: Is $2,400 in Sight?

From a technical perspective, gold is currently meandering below the restrictive 50-day Simple Moving Average, suggesting a lack of strong directional bias in the near term.
The recent break above the trendline connecting the “Head” and “Right Shoulder” of a previously forming Head and Shoulders (H&S) pattern on the daily chart has invalidated this bearish formation. While the possibility of a more complex multi-shouldered topping pattern remains, the odds have diminished following this trendline break.
Looking at potential upside targets, a break above $2,340 could pave the way for a move towards $2,369, the June 21 high. Beyond this, the next significant resistance lies at $2,388, corresponding to the June 7 peak.
Conversely, if sellers manage to push prices below the compromised topping pattern’s neckline at $2,279, it could trigger a deeper correction. In this scenario, a conservative downside target would be $2,171, derived from the 0.618 Fibonacci ratio of the pattern’s height projected lower.


