Key Insights
- The NZD/USD pair is attempting to recover, approaching the key resistance level of 0.6100.
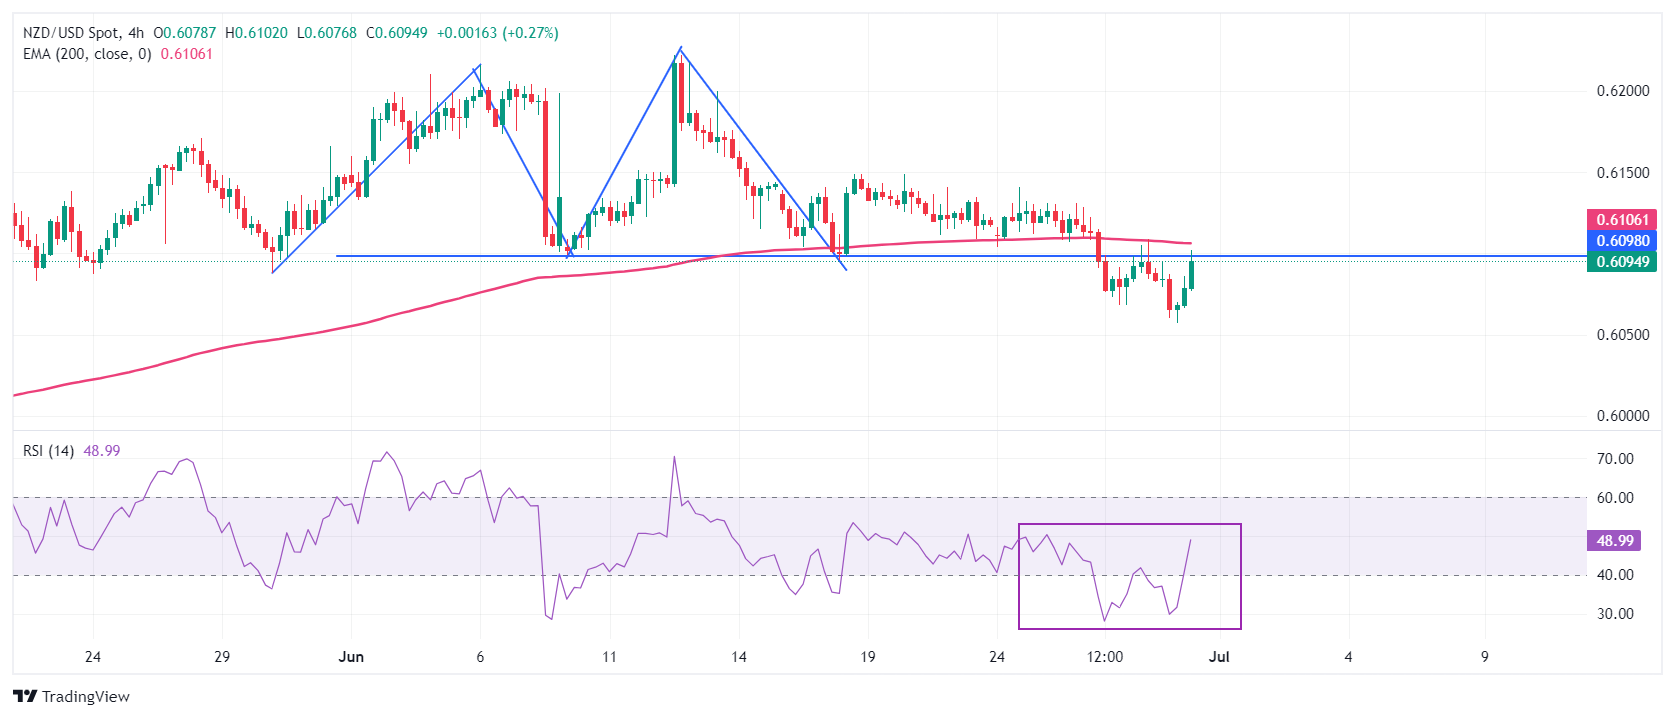
- A Double Top pattern breakdown occurred on the 4-hour chart, signaling a potential bearish reversal.
- The 200-period EMA at 0.6106 is acting as a significant resistance level for bullish momentum.
The NZD/USD pair is staging a comeback, clawing back its intraday losses and eyeing the critical 0.6100 resistance level in Friday’s American session. This resurgence comes on the heels of a weakening US Dollar, following the release of the closely watched Personal Consumption Expenditure (PCE) inflation report, which revealed a softer-than-expected inflationary environment in May.
The PCE data showed a year-on-year deceleration to 2.6% from the previous 2.8%, while monthly figures indicated a more modest increase of 0.1%, down from the upwardly revised 0.3%. This cooling inflation has fueled speculation about potential early rate cuts by the Federal Reserve, putting pressure on the greenback. Consequently, the US Dollar Index (DXY) has retreated to around 105.80.
Looking ahead, the Kiwi’s fate may hinge on Monday’s release of the Caixin Manufacturing PMI data for June. With expectations of a slight moderation to 51.2 from 51.7, any significant deviation could sway the NZD, given New Zealand’s strong trade ties with China.
NZD/USD’s technical outlook

From a technical standpoint, the NZD/USD pair has recently broken down from a Double Top pattern on the four-hour chart. This bearish signal was triggered by a move below the June 10 swing low near 0.6100. However, the 14-period Relative Strength Index (RSI) has rebounded into the 40.00-60.00 range, suggesting a potential easing of downside momentum.
The 200-period Exponential Moving Average (EMA) at 0.6106 continues to serve as a formidable resistance for Kiwi bulls. A pullback towards 0.6100 could present a selling opportunity, with potential targets at the April 4 high of 0.6050 and the psychologically significant 0.6000 level.
On the flip side, a decisive move above the June 12 high of 0.6222 could shift the momentum, potentially exposing the pair to further upside towards the January 15 high near 0.6250 and the January 12 high around 0.6280.


