Key Insights
- USD weakening due to Japanese market crash, falling yields, and weak US economic data
- ISM data release could further confirm recession fears; 60% chance of emergency rate cut priced in
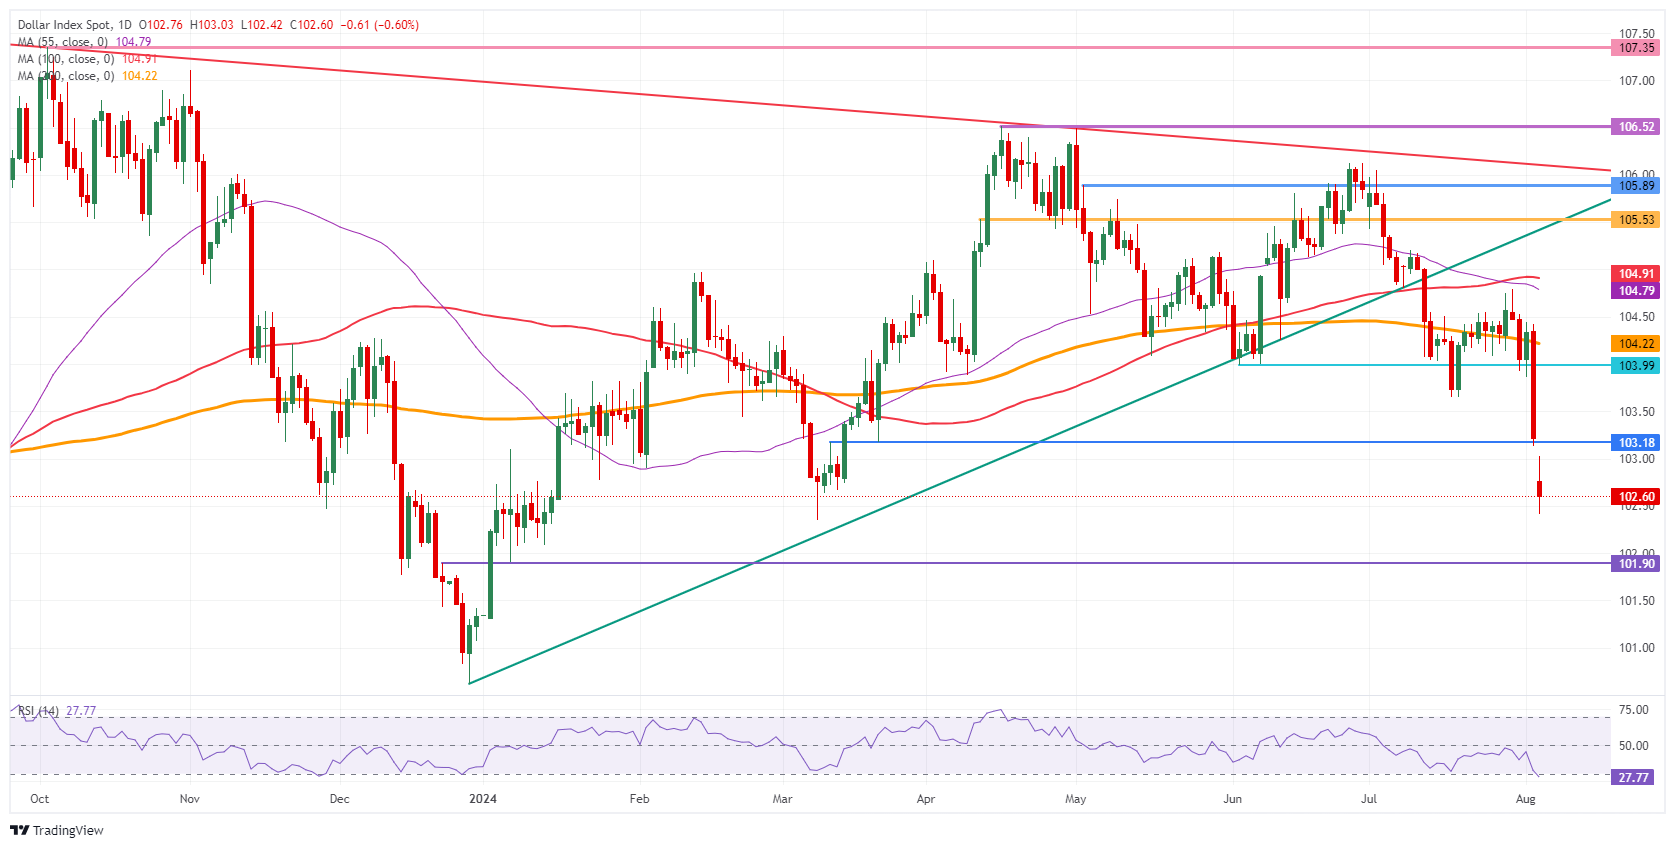
- DXY technical analysis shows potential bottoming, with key levels at 103.18, 104.00, and 102.35
The US Dollar is facing significant headwinds as we kick off the week, with its decline gaining momentum as we approach the US trading session. This downturn comes on the heels of a relatively stable European session, but the calm was short-lived. The primary catalyst for this shift appears to be the dismal performance of Japanese equities, with both the Nikkei and Topix indices closing down over 12% – a bloodbath not seen since the 1987 crash for the Nikkei. This shocking development has triggered a flight to safety, with investors rushing towards bonds, consequently pushing yields lower.
As yields fall, the US Dollar is losing its luster. This trend is further exacerbated by a string of disappointing US economic data releases, which no longer support the Greenback’s strength. Adding to the Dollar’s woes, market participants are now pricing in a staggering 60% probability of an emergency rate cut in August, according to Bloomberg reports.
Looking ahead, traders are bracing themselves for a slew of data from the Institute of Supply Management (ISM). These numbers could potentially reinforce the growing recession narrative if they disappoint. Fortunately, the economic calendar for the remainder of the week is relatively light on first-tier data points, which may allow markets to stabilize as the week progresses.
On the data front, we’re expecting the final readings of the S&P Global Purchasing Managers Index (PMI) for July, with the Services PMI projected at 56 and the Composite figure anticipated to hold steady at 55. Following closely, the ISM will release its July figures, with the Services Employment Index expected to inch up to 46.5 from 46.1, while the Services PMI is forecast to move out of contraction territory to 51 from 48.8.
The panic in the markets is palpable, with US equities taking a significant hit. The tech-heavy Nasdaq is leading the decline, down 4%, while European stocks are faring slightly better with average losses of 2.5%. Meanwhile, the bond market is seeing increased activity, with the US 10-year benchmark rate hitting a new 52-week low at 3.69%.
DXY Technical Analysis

Turning our attention to the technical analysis of the US Dollar Index (DXY), we can see that the Greenback has finally cracked under the pressure of weak economic data and market turmoil. However, it’s important to note that this is not a fire sale situation. The Relative Strength Index (RSI) is indicating that we may be nearing the end of this sell-off, with equity losses in Europe and the US currently contained.
Looking at potential recovery levels, we have a three-tiered structure to consider. The first level to watch is 103.18, which held on Friday but was breached during Asian trading hours on Monday. If the DXY can close above this level, the next target would be 104.00, which served as support in June. Beyond that, the 200-day Simple Moving Average (SMA) at 104.22 presents the next significant resistance level.
On the downside, the oversold RSI should prevent further steep losses for the DXY. The nearest support lies at the March 8 low of 102.35. A break below this level could put pressure on the psychologically important 102.00 mark, with 101.90 serving as the next critical support – a level that played a pivotal role in December 2023 and January 2024.


