

Swing trading is all about taking advantage of short-term price movements and trends in either direction. Swing traders aim to profit off these swings over the time period of days to weeks. But what indicators can help identify the most accurate entry and exit timing for these volatile trades?
In this beginner’s guide, we’ll answer the question – what are the best indicators for swing trading?
We’ll also cover tips like combining indicators for greater signal accuracy, choosing setups based on your trading style, and customizing indicator periods through backtesting.
Follow along as we review the top swing trading indicators to take the guesswork out of timing entries, exits and setting profit targets. Let’s get started!
Best Indicators for Capturing Profitable Swing Trades
Moving Averages
A moving average is a popular swing trading indicator that shows the average closing price of a stock over a defined period of time – for example, over the last 20 days or 50 days. It creates a smoothing effect to spot price trends easier.
There are two main types:
Simple Moving Average (SMA) – Simply takes the arithmetic average of closing prices over X number of days or weeks. For example, a 50-day SMA adds up the last 50 closing prices and divides the total by 50.
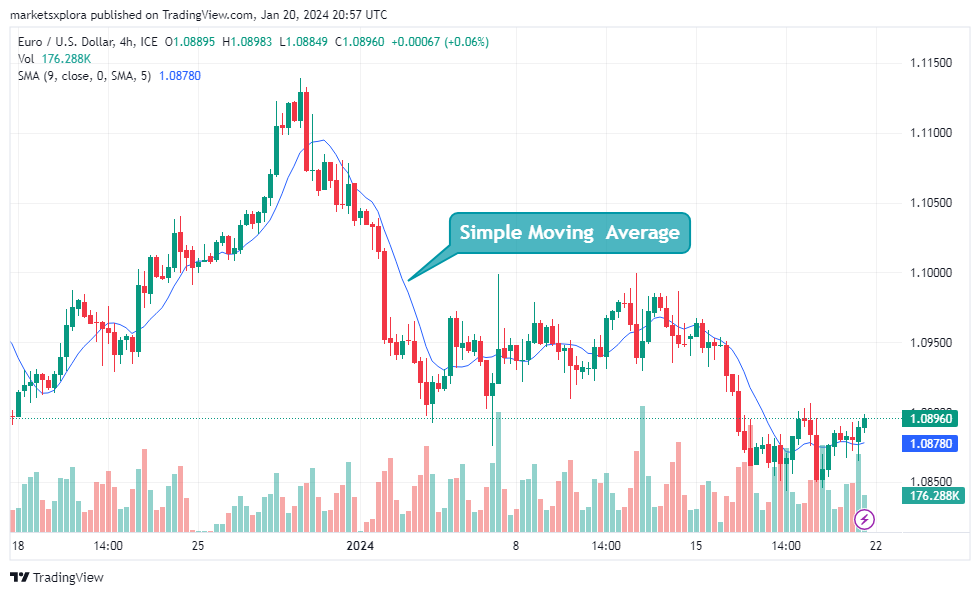
Exponential Moving Average (EMA) – Gives more weight and importance to recent closing prices in the calculation. This causes it to react faster to the latest price shifts.
When the shorter period EMA or SMA crosses above or below the longer period one, it signals a potential change in the trend’s direction.
For example:
- The 20-day EMA crosses above the 50-day EMA – This suggests an uptrend is forming, and swing traders will generally look to buy around that crossover point.
- The 10-day SMA crosses below the 20-day SMA – This signals the uptrend is possibly reversing into a short-term downtrend. Active swing traders may sell or take profits as this crossover happens.
Choosing the optimal moving average periods to configure is key for swing trading. Analyzing historical charts to backtest SMAs and EMAs tuned to shorter vs longer term swings (10-day, 20-day, 50-day, etc.) is recommended.
MACD
The MACD (Moving Average Convergence Divergence) indicator was created to show the relationship between two moving averages and identify shifts in momentum. This makes it useful for swing traders looking to time entries and exits.
It works by taking the faster 12-period EMA and subtracting the slower 26-period EMA. This gives the MACD main line. It shows positive momentum when above 0, and negative when below.
MACD also displays a “histogram” – a visual representation of the distance between the MACD line and its 9-period “signal” line. The changing size and flipping above/below 0 of the histogram highlights accelerating price momentum.
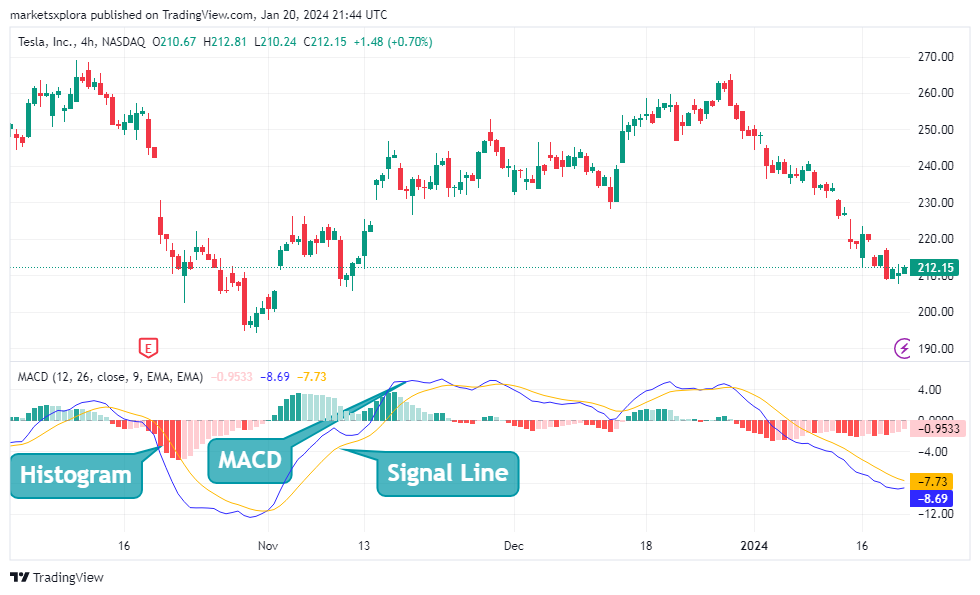
As an example – If the histogram shrinks and MACD crosses below the signal line, it indicates an uptrend is possibly reversing into a short-term downtrend. Aggressive swing traders may initiate short positions around that MACD crossover point.
The key with MACD is it can identify shifts from increasing to decreasing momentum. This helps time new swing trade entries or profit taking on existing positions earlier than only watching the price chart alone.
RSI
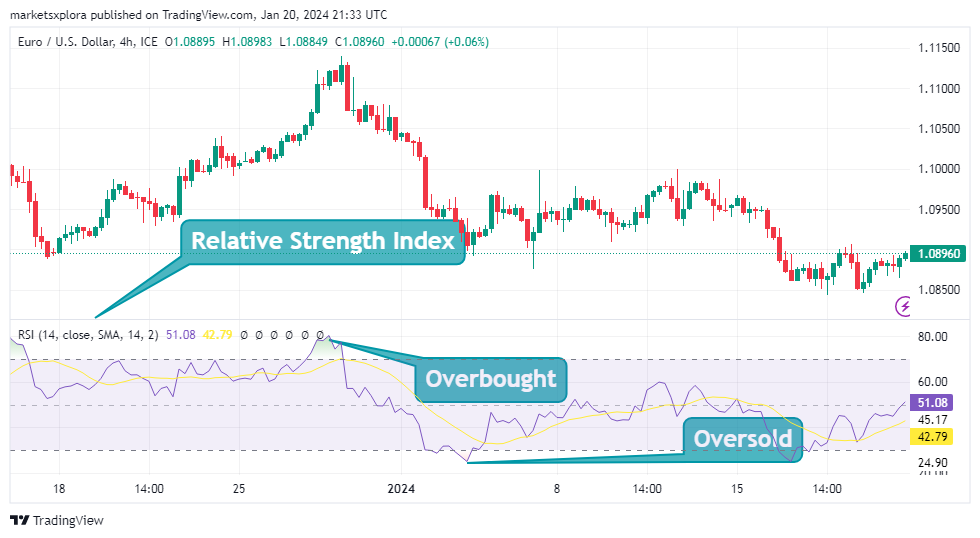
The Relative Strength Index (RSI) is a momentum indicator that measures whether a stock is overbought or oversold. This helps swing traders identify potential reversal points.
It calculates a 0-100 RSI score based on the size of recent gains versus recent losses over a set period. Typically 14 days is used.
An RSI reading of 70 or above indicates possible overbought conditions – signaling the swing may be peaking. RSI under 30 suggests oversold conditions – suggesting a short term bottom.
Swing traders will often sell or take profits when RSI hits 70. And they’ll consider buying around 30 as uptrends start to form again coming off bottoms.
For example:
- If RSI hits 75, then starts declining, while the price is still rising, divergence forms. This suggests potential topping swing reversal ahead.
- If RSI makes lower lows under 30, while price holds steady above former swing bottoms, bullish divergence signals expected upside continuation.
Using RSI with chart patterns like double tops/bottoms or bull and bear flags can improve timing of entry and exit points. RSI divergence combined with classic swing chart patterns is an especially powerful combo for timing.
Bollinger Bands
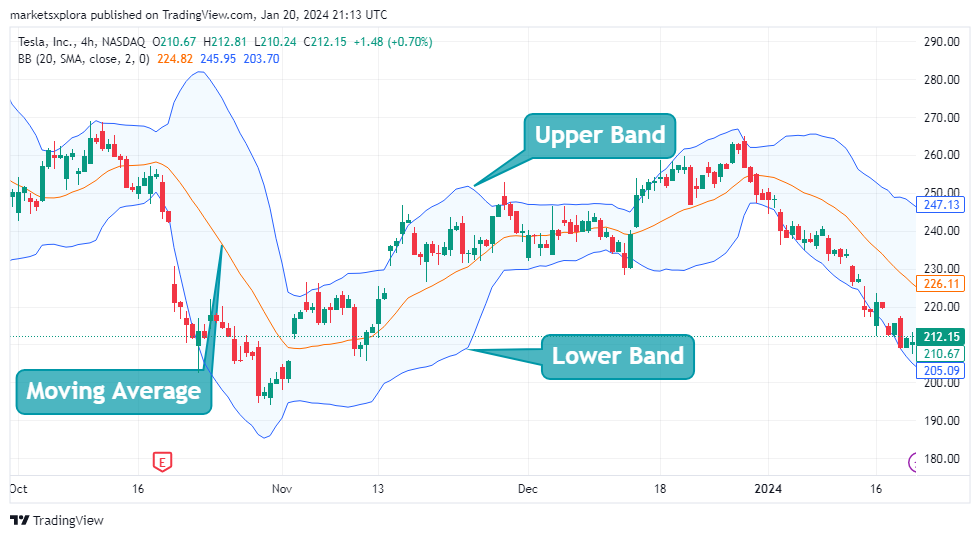
Bollinger Bands plot variable width bands above and below a simple moving average line. They adapt to market volatility.
As volatility increases, the bands widen. During calm, low volatility periods, they narrow. This dynamic nature helps identify swings trades.
During sharp expansions in volatility, the bands stretch far apart. If the price then touches the upper or lower band, there is often a quick reversal. This sets up potential swing trades.
For example:
- Price hitting lower band – Could signal oversold bounce ahead. Traders buy expecting upswing.
- Price tags upper band – Indicates possible overbought pullback coming. Traders sell or short in anticipation.
In between swings, decreasing volatility leads bands to narrow and “squeeze” together. When a sharp breakout finally happens it signals potential new swing forming.
The middle band line also acts as support or resistance for price swings, like moving averages. Buying as price bounces off the 20-period MA line or selling into resistance tags is common.
Tuning the periods used and combining bands with other swing indicators like RSI improves timing of these continuation and reversal signals at extremes.
How to Use Multiple Indicators Together
While individual swing trading indicators like moving averages, MACD, RSI and Bollinger Bands each offer their own signals – combining indicators together can create more reliable trade triggers.
Each indicator focuses on different factors like momentum, volatility, overbought/oversold levels, etc. By confirming signals from two or more indicators, traders improve timing and avoid false signals.
Some examples of effective swing indicator combinations:
- RSI + Price Action: Buying when RSI rebounds off 30-level combined with a bullish engulfing price candle or swing chart pattern confirms upside momentum.
- MACD + Bollinger Bands: MACD crossing up through signal line as price squeezes and breaks out above Bollinger Bands upper band signals potential strong upside swing ahead.
- Moving Averages + Volume: A bullish crossover of the 20-period and 50-period EMA lines on rising trading volume helps confirm upside swing trade.
There are many ways to mix and match swing trading indicators to create optimal signal confirmation for both entry and exit timing. Traders should backtest to find the specific combinations that fit their goals and risk tolerance.
How to Choose the Best Indicators for Swing Trading
While popular swing trading indicators can be effective in many market conditions – Traders should pick specific indicators and configure periods based on the three factors:
- What direction you are trading: For uptrend trading, momentum indicators like MACD and RSI to identify bounces out of oversold work well. For downtrends, overbought indicators to time tops are preferable.
- Market context: In volatile sectors like technology, bands and volatility indices help. For quiet stocks, simple crosses of key moving averages may be best. Match context.
- Personal trading style: Active traders may opt for faster 5-10 day setups, while position swing traders focus on daily or weekly charts over 20-50 days. Use longer or shorter periods based on holding times.
An active swing trader who trades technology stocks in uptrends may optimize RSI(14) and MACD(12,26) tuned to shorter terms swings under 10-15 days.
While a position swing trader in conservative sectors may use weekly charts with 50-100 day SMAs and basic Bollinger Bands to enter extended moves lasting weeks or months.
Determine your own trading goals and style first – then select and customize indicators that align with them.
Best Indicators for Swing Trading: Conclusion
Swing trading aims to capture gains from short term price moves lasting days to weeks. Indicators serve to improve trade timing and signal optimal entry/exit points.
Moving averages, MACD, RSI and Bollinger Bands each highlight important trend, momentum and volatility factors. Using them individually or in combination provides objective trade triggers.
To use swing trade indicators effectively:
- Match indicators to market context, trade direction and personal style
- Combine indicators to confirm swing signals
- Customize indicator periods based on backtesting
- Practice reading indicators in a paper trading account
Mastering both chart patterns and indicators together provides the optimal toolkit for successful swing trading. Traders should continue studying examples and test theories in paper trading and small position sizes at first.
With the basics now understood, newcomers have what they need to further research strategies, practice trade signals, and use key indicators like these as part of a complete swing trading plan tailored to their goals.
The key is turning theory into practice.
FAQs
- What are the best time periods for configuring swing trade moving averages?
Test faster 5-20 days for active trades, or slower 20-50 days for position swings lasting weeks.
- How do you read RSI levels to identify overbought and oversold swing signals?
Over 70 suggests overbought, while under 30 signals oversold and pending reversal ahead.
- What’s the best way to combine swing trading indicators together?
Confirm signals from indicators assessing momentum, volatility, etc. for reliable triggers.
- Can you use indicators effectively for short term swing trading?
Yes, faster MACD, RSI & bands tuned to shorter 5-15 day periods help time compressed swings.
- What beginner mistake causes issues using swing trade indicators?
Not backtesting periods and combinations to match personal trading style and goals.
Please let us know in the comment section if you have any other questions on applying swing trade indicators!